Key Takeaways:
- The SAND price closed the previous day’s trade at INR 222.86 with a market capitalization of INR 338 Cr and a circulating supply of 116 Cr SAND tokens.
- SAND price currently aims at a 30% upswing after a significant breakout from the descending trend.
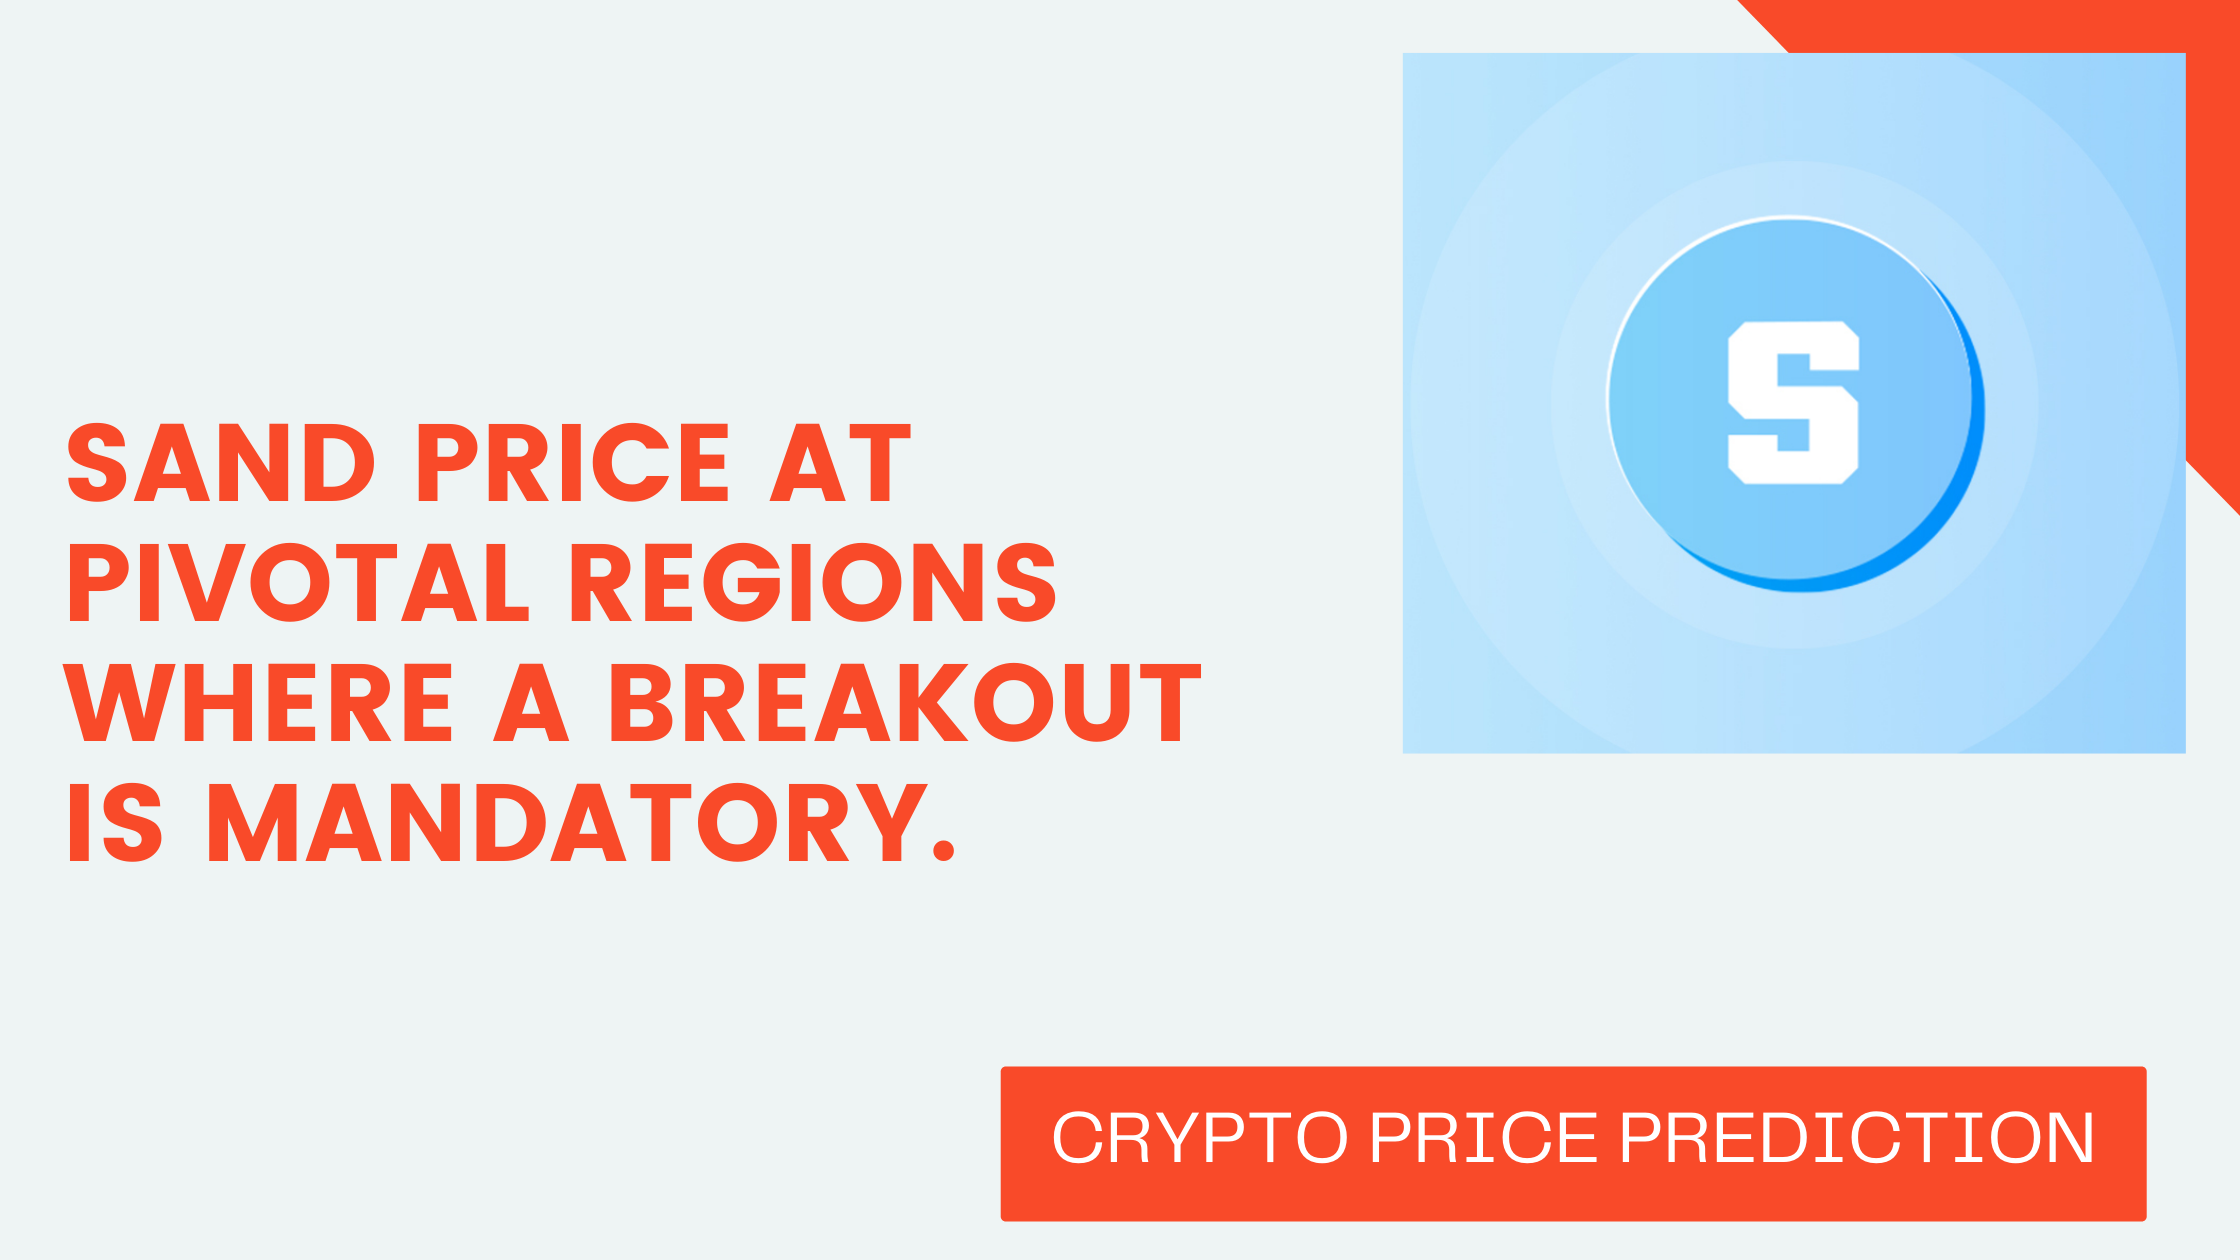
The Sandbox Price Analysis: Will SAND Price Hit INR 500 in April?
The SAND price from the past couple of days is trying to validate a strong uptrend after breaking out from the descending parallel channel. Therefore, the asset is expected to record consecutive uptrend candles which may include some minor consolidations. Therefore, the price may try to secure the levels above INR 250 at the earliest and head towards INR 300.
However, a strong uptrend may assist the price to ignite an upward trajectory beyond INR 300 which may be restricted below INR 350. Therefore, INR 500 is a little tedious job right now but could be achieved in the current quarter.
The Sandbox Price Prediction: How High Will SAND Price Go in 2022?
The SandBox price after a gigantic rally during the NFT boom in Q4 2022, maintained a notable descending later. The price is currently attempting to range high after failing multiple times to break through by reaching the apex of consolidation. A breakout from these levels may end the downtrend soon and ignite a strong uptrend.
Further, the price may aim to reach INR 300 by the end of April and try to seal off the Q2 trade somewhere near INR 500. However, the bears could jump in as the price approaches the ATH but the price may remain above INR 600. Later the price may head towards INR 750 to INR 800 to end the 2022 trade.
The Sandbox Price Analysis: SAND Price Table (Last 07 Days)
| Date | All-Time High | All-Time Low | Market Capitalization |
| 19 April 2022 | INR 230.84 | INR 206.78 | INR 338 Cr |
| 18 April 2022 | INR 212.02 | INR 192.00 | INR 317 Cr |
| 17 April 2022 | INR 215.24 | INR 202.24 | INR 320 Cr |
| 16 April 2022 | INR 222.23 | INR 211.19 | INR 322 Cr |
| 15 April 2022 | INR 215.18 | INR 209.25 | INR 324 Cr |
| 14 April 2022 | INR 222.04 | INR 205.94 | INR 320 Cr |
| 13 April 2022 | INR 219.86 | INR 208.61 | INR 330 Cr |
The Sandbox Price Prediction: SAND Price Trend Comparison with MANA (Last 30 Days)

Source: Tradingview
The SandBox & Decentraland are the two popular NFTs in the crypto space which share a deep correlation. Both the assets surge at almost the same time, however, both maintain their respective intensity. And hence the price trend of both the tokens are also much similar to each other.
At present, the SAND price is trading 8.65% above the average levels after rebounding from -5%. On the other hand, MANA’s price is swinging around -6.68%, which is below the average level after visiting -15%.
Additional Reading: MANA vs SAND
Correlation of SAND/USDT and SAND/BTC (Last 30 Days)

Source: Tradingview
Sandbox prices maintained a similar trend with both the USDT and BTC trading pairs. The trend of both the pairs is swinging hand in hand with almost equal intensity of surges and plunges. Both the trading pairs varied from hitting highs around 26% above the average levels to as low as -8%. However, currently, the SAND/USDT pair is trading at 5.6% above while the SAND/BTC pair is at 4.48% higher than average levels.
Additional Read: SAND Technical Analysis
Where & How to Buy The Sandbox (SAND) Coin
Want to buy a SandBox coin, CoinDCX offers you the best deal in the market along with additional features and benefits. Download the CoinDCX App and register yourself. Once done, transfer funds from your bank account to the CoinDCX wallet and buy a SAND token.
Investing in any token has become much easier and safe with the newly launched Crypto Investment plan(CIP). Instead of investing huge amounts, you can break them into simple weekly investments. Therefore, start investing in Bitcoin & other cryptos with Crypto Investment Plan now!
Disclaimer: Crypto products and NFTs are unregulated and can be highly risky. There may be no regulatory recourse for any loss from such transactions. In case you have any queries, write to support@coindcx.com.
The above information represent the independent views of Primestack Pte. Ltd, Neblio Technologies Pvt. Ltd, and/or their affiliate entities and are for informational & educational purposes only. The content, information or data provided above is not an offer, or solicitation of an offer, to invest in, or to buy or sell any interest or shares, virtual digital assets/ crypto products or securities, or to participate in any investment or trading strategy. Any statement or communication made above shall not be treated as a legal, financial, investment or tax advice by the reader. The calculations, data, risk-return formulations, performance or market capitalization indicators captured above are based on the independent data sourcing including collation of public information and/or analysis performed by analysts, advisors or employees of Primestack Pte. Ltd/ Neblio Technologies Pvt. Ltd and/or their affiliate companies and/or any third party. Past performance is not indicative of any future results. The reader(s) are hereby advised to consult their financial/ legal/ tax advisor(s) before making any investment.
Related posts
Injective Price Prediction: Can INJ Price Hit $100 in 2025?
INJ price shows recovery signs; bullish potential if resistance levels break.
Fetch.AI Price Prediction 2024-2030: Can FET Price 3X to Hit $5?
Dive into Fetch.AI’s outlook with our in-depth 2024-2030 price forecast. Will FET triple to achieve $5?