Key Takeaways:
- The Sandbox price after gaining more than 100% in the past fortnight is consolidating close to the crucial resistance aiming to set out a fresh bearish wave soon
- The long-term fractals appear bullish presently, despite the frequent bearish interference and eventually reach the desired target by surging another 100%
- The token is slowly gaining upper hand among the traders as the whales shed off their holdings, creating significant volatility within the space
Additional Read: Apecoin Price Prediction
| Price | $0.6951 |
| 24H Price Change | +2.04% |
| 7D Price Change | +36.25% |
| MarketCap | $1.04 billion |
| Circulating Supply | 1.49 billion |
| Trading Volume | $303.4 million |
| ATH | $8.44 |
| ATL | $0.02894 |
The Sandbox Price History
- Launched in 2011, the Sandbox entered the world of the trade before the beginning of the bull run, in 2020.
- The price remained heavily consolidated under $1 for the first 3 quarters and with the beginning of the Q4 2021 trade, the price exploded
- The price rose gigantically by more than 1000% from levels around $0.76 to as high as $8.48 in less than a month which ended up attracting the bear for an extended period
- The price then began to trade under extreme bearish conditions and depleted heavily and lost more than 96% of its value.
- However, the price appears to be preparing for a rebound and with this, a suitable recovery may be expected
The Sandbox Technical Analysis
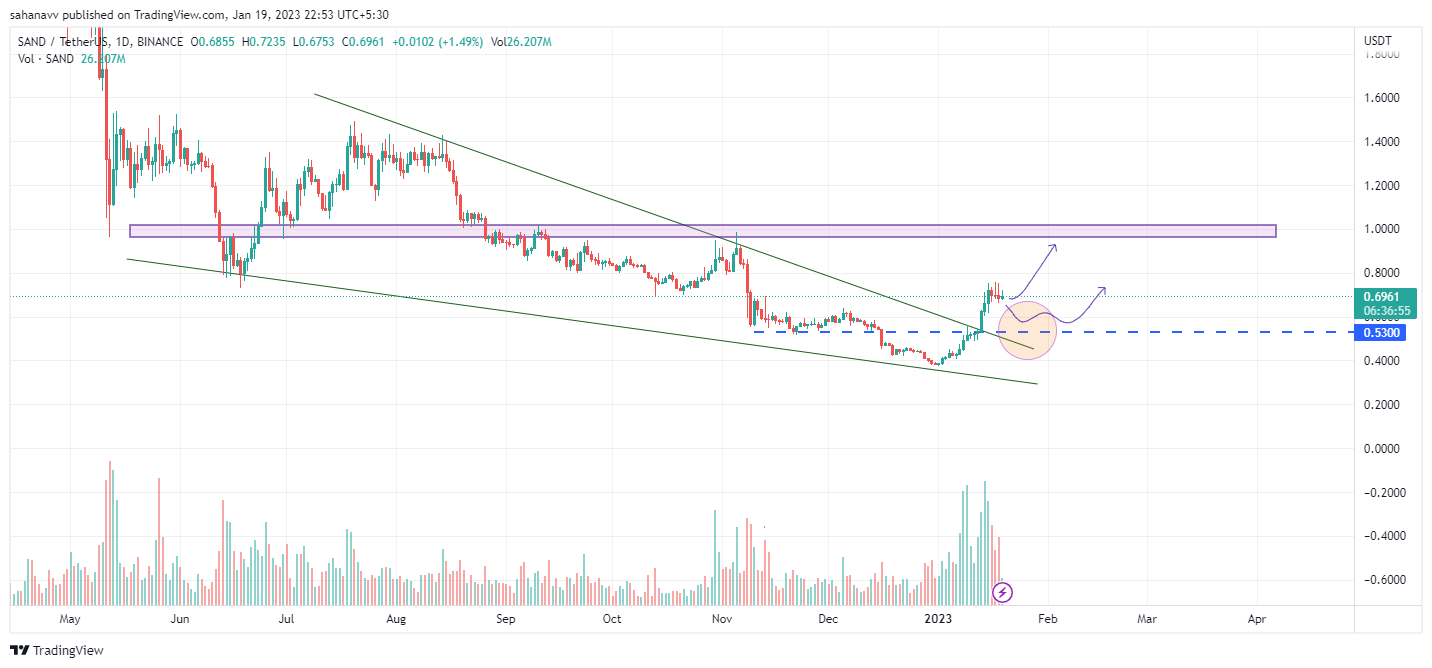
Source: Tradingview
- The Sandbox price after trading within a huge falling wedge for quite a long time, bounced off the resistance but failed to reach the pivotal resistance levels
- After breaking above the wedge, the price is consolidating within a very narrow range due to which it may possibly drop slightly and rebound but after a brief accumulation
- Else, the SAND price may rebound from the current levels and quickly attain the upper resistance zone that happens to be above $1
- However, the bearish activity is expected to intensify at these levels, hence if bulls get drained, then the price may begin with a fresh bearish wave.
Overview of The Sandbox On-chain Analysis:
The Sandbox Supply on Exchanges
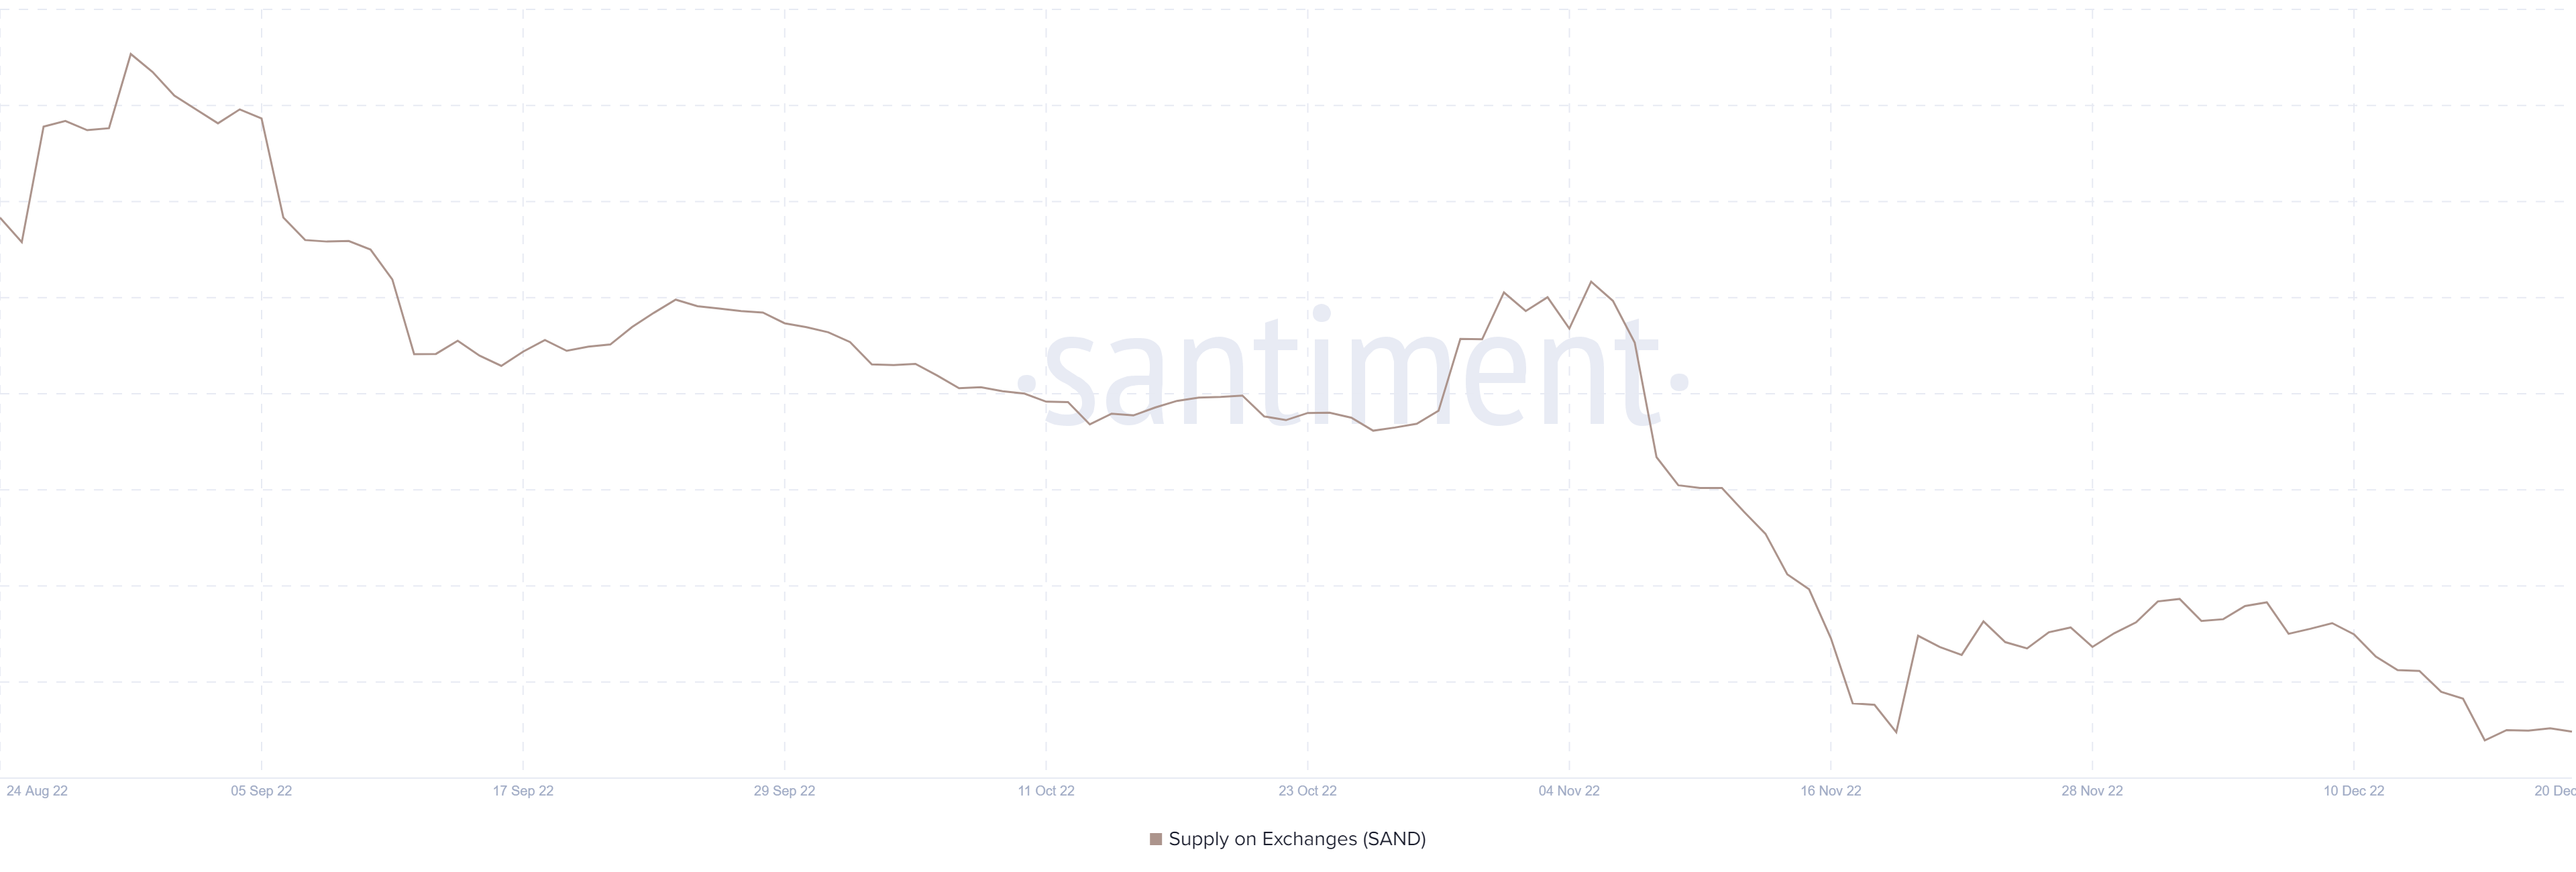
Source: Santiment
The Sandbox supply on exchanges indicates the total number of assets present in the wallets of the exchanges. Usually, the supply on the exchanges increases when the traders flush their holdings onto the exchanges from their wallets. This may highlight their intention of either carrying out a sell trade or just swapping their tokens for another crypto.
Here, the supply has been dropping heavily since the FTX fiasco which indicates that the tokens are held safe in the wallets It also indicates that the traders are willing to hold the token for a long time, and hence are not impacted by the current market movements. However, with a significant rise in prices, these fractures tend to flip.
The Sandbox Network Growth
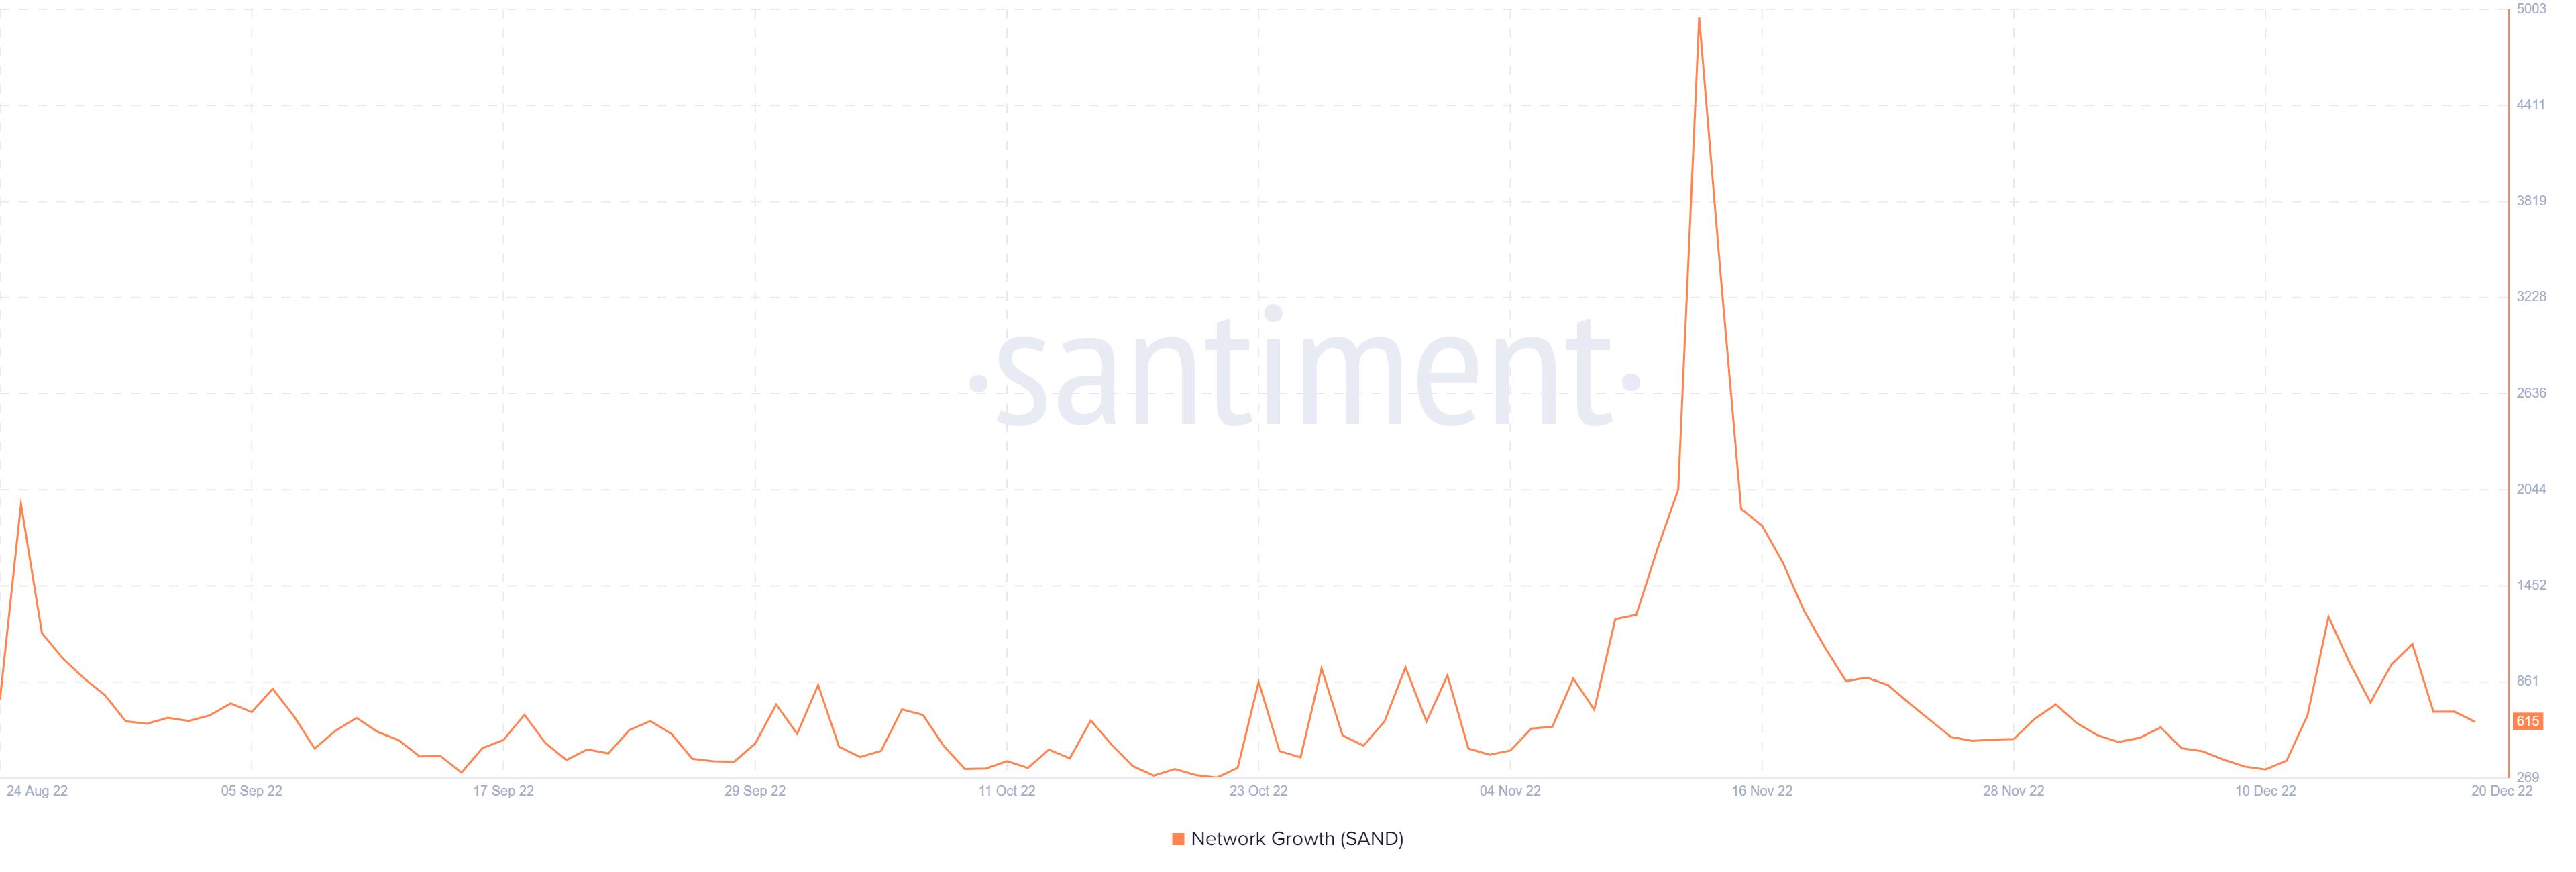
Source: Santiment
Network activity is much similar to the daily active address which records the total number of addresses interacting with the platform. It records the number of new addresses that carry the trade for the first time. These metrics indicate the adoption over time which is used to know whether the project is gaining or losing traction.
The token’s network growth surged heavily in November as the market collapse invited many new hands onto the platform. It gained huge traction in a small time frame but soon lost all the gained attention as the price remained largely compressed due to extensive bearish pressure until the end of 2022.
The Sandbox Supply on Top Addresses
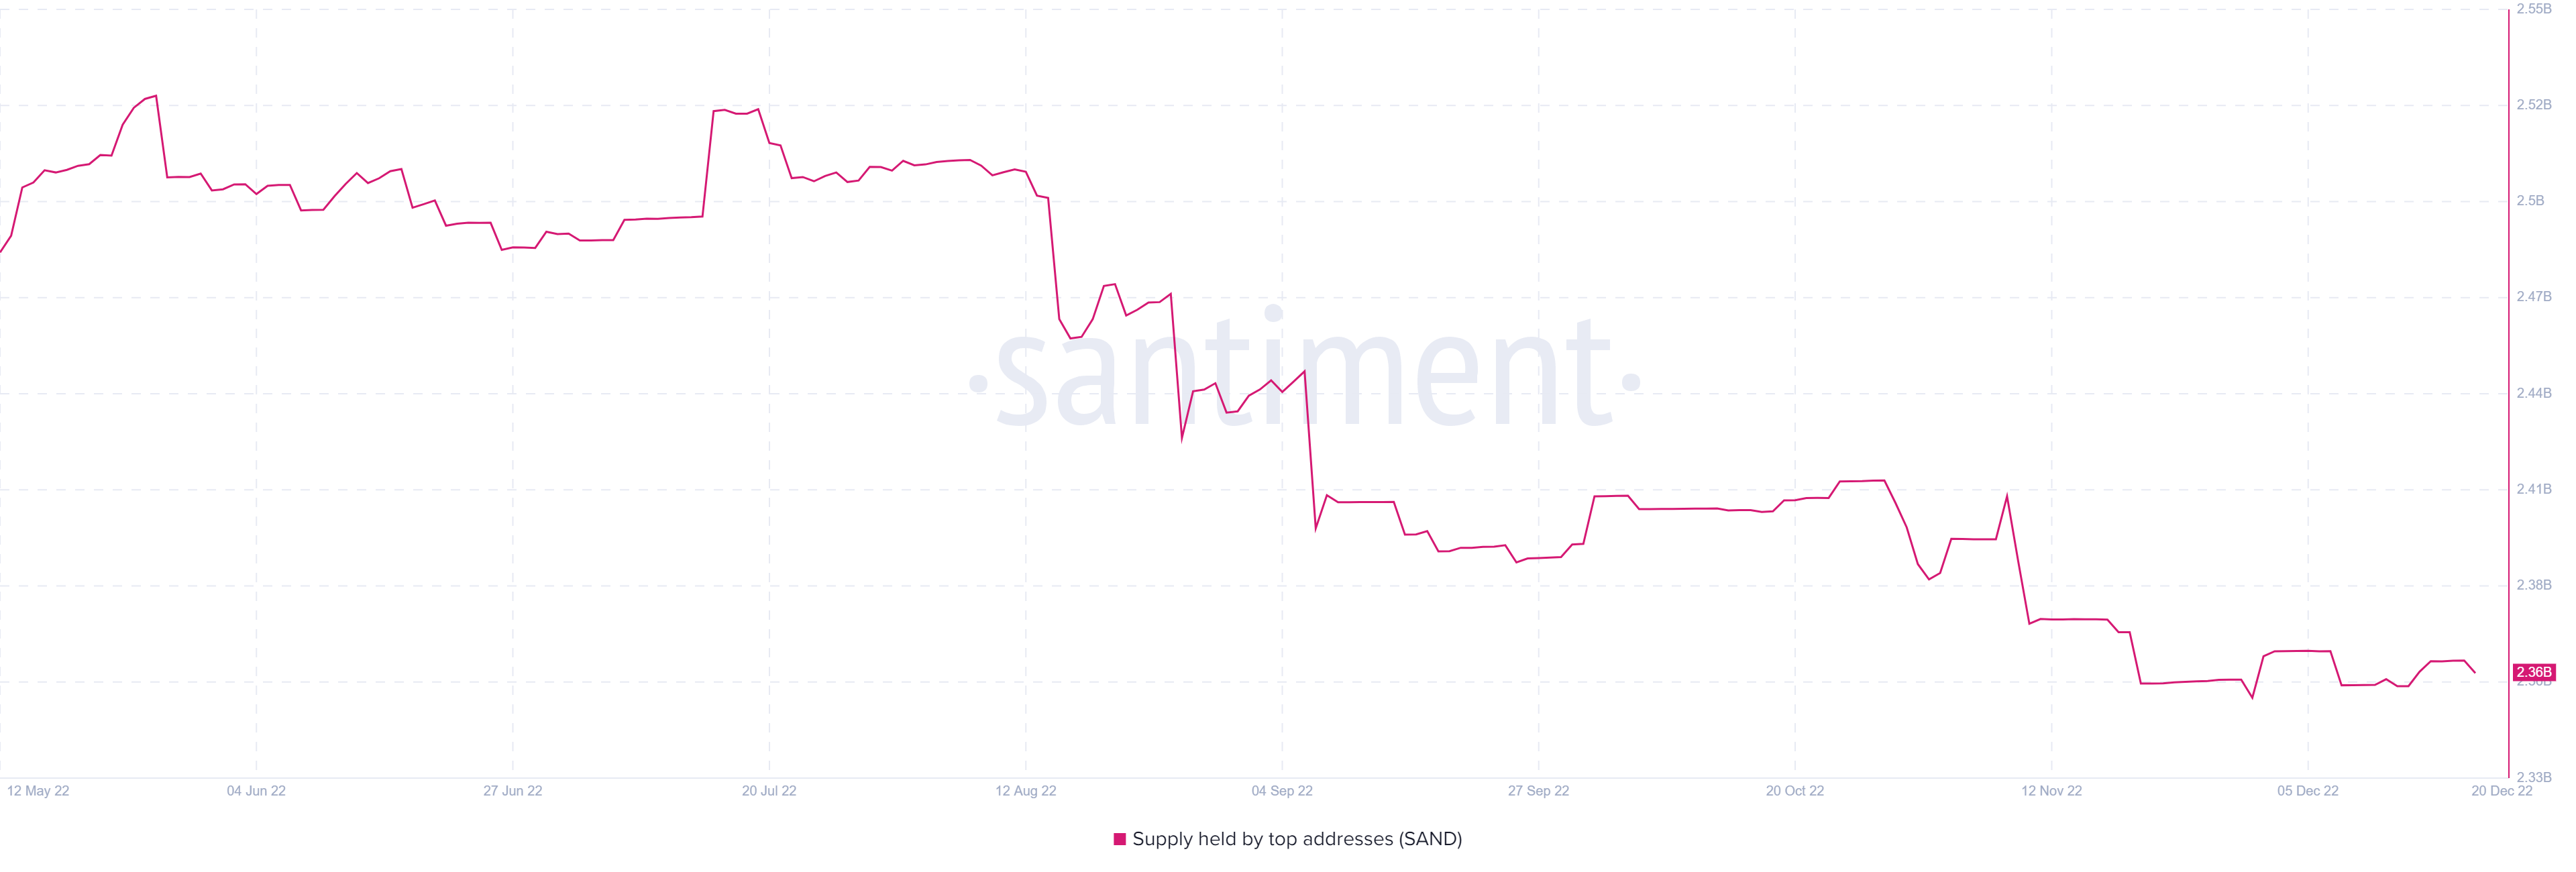
Source: Santiment
The supply on top addresses indicates the number of tokens held by the top addresses with huge balances. These addresses could be of the whales who usually hold 1% of the circulating supply. An increase in their holdings induces confidence among the market participants who accumulate following the bullish market sentiments.
Woefully, the SAND supply on top addresses has dropped heavily ever since the crypto market fell from the cliff in May. This could be a bearish indicator as whales dumping on the token could have a negative impact on the other market participants. However, it may not directly impact the price in a negative way but could compel it to consolidate.
The Sandbox Price Prediction for 2023
The Sandbox price previously surged during the NFT boom in the last few months of 2021 and since then has been trading within a descending trend. However, the bullish start for 2023 displayed a ray of hope for a revival of the bullish trend. Regardless of the persisting pullback, the token could ignite a rebound to reach the upper targets soon.
By the end of Q1, the SAND price may reach the level around $1.15 after facing a significant bearish action at $1. Further during the Q2 trade, the price may surge to test the important resistance at $1.5. These levels have held the price tightly in times of bearish pullback and hence clearing these levels may ignite a notable uptrend. By the end of the year 2023, the price may hover around $1.88 to $1.97.
Read More: Top Metaverse Projects In 2023
The Sandbox Price Prediction for 2024
The SAND price may surge beyond $2 in the first few days of 2024 and further rise close to $2.4 surpassing the levels around $2.33 by the end of Q1 2024. Furthermore, during the Q2 trade, the markets are expected to turn bullish as the star crypto Bitcoin is expected to undergo a halving. The bullish momentum generated after the event may assist the price to close the H1 2024 trade around $3.3.
During the second half of 2024, the markets may have gained enough bullish momentum that may assist the price to close the Q3 trade around close to $3.5 to $3.7. By the end of the 2024 trade, the SAND price is believed to trade very close to $4. An extended bullish action may even raise the price beyond $4.3.
The Sandbox PRICE PREDICTION 2025-2030
After a bullish close for the year 2024, the momentum could be continued throughout 2025 wherein the price may mark new highs. While the ATH could be achieved somewhere during the mid of 2026 and soon fall into a bearish trap. The year 2027 could be largely under the control of the bears and the price may even drop hard close to or even below $4.5.
However, after undergoing significant bearish action, the first half of 2028 could be consolidated as the bulls may accumulate strength to rise high. During the 2029 trade, the SAND price may pull a massive leg up and slice through its ATH and form a new one beyond $10. However, during 2030, the price may rise to $11 or $12 and later experience a pullback to hover around $10.
| Year | The Sandbox Price Forecast |
| 2023 | $1.88 to $2 |
| 2024 | $3.8 to $4.1 |
| 2025 | $4.4 to $4.8 |
Should you invest in The Sandbox in 2023?
The Sandbox price has maintained a notable trend since its inception and moreover, withstanding the bearish pressure, the token has displayed its potential to leap long as soon as the bearish clouds wane off. Therefore, the price could ignite an intensified upswing in the coming days. Before jumping on the moving train, it’s better to have deep knowledge.
One should have complete research of the project, the team, their vision, etc, and also observe the price movements closely before investing in any token.
FAQs
What will The Sandbox be worth in 2023?
The SAND price is believed to trade close to $2 by the end of 2023
What will be the price of 1 The Sandbox in 2030?
The Sandbox price could attempt hard to reach a double-digit figure and may be successful enough to do so in 2030
Will The Sandbox ever hit $10?
The Sandbox price appears to be determined by the upcoming trend and hence could go long quickly in the coming days.
Is The Sandbox a safe investment?
The SAND price has displayed its potential to go long and hence can be considered a safe investment provided the trader has enough knowledge of cryptos and the market.
Related posts
Cardano Price Prediction 2024: Can the Chang Upgrade Trigger Rally to $1?
Cardano’s technical strength, and 2024 price predictions analyzed.

Sui Price Prediction 2024-2030 : Can SUI Price Touch $4 in 2025?
SUI price is struggling hard to lay down a strong bullish trend.