
Key Takeaways
- The Graph token has been trading within a steep bearish trend since the start of the year while sustaining firmly above the bearish pattern.
- Meanwhile, the rally has approached the end of the consolidation, which may trigger a bullish breakout very soon.
- The technicals have been flashing bullish signals; hence the price is believed to undergo a breakout and mark new yearly highs.
The Graph Overview as of August 02, 2023
| The Graph Price | $0.11 |
| 24 Price Change | +2.07% |
| 7D Price Change | +2.2% |
| Market Cap | $1.01 billion |
| Circulating Supply | 9.11 billion |
| Trading Volume (24-Hour) | $22.29 million |
| ATH | $2.88 |
| Fear-Greed Index | 53 (Neutral) |
| Sentiment | Bearish |
| Volatility | 4.38% |
| Green Days | 17/30 (57%) |
GRT Price Forecast For This Week
The Graph token has been bearish for a long time and has been shedding massive gains. Moreover, the volatility remained extremely low as the volume reached its lowest levels, suggesting the price is experiencing extreme bearish pressure. Therefore, the GRT price may continue trading sideways for some more time, mounting additional pressure that may result in a bullish breakout very soon.
Although the GRT price began the weekly trade on a bearish note, the possibility of a bullish breakout looms over the token. The technicals are slowly flipping in favor of the bulls, which may lift the price toward the interim resistance after undergoing a breakout. Moreover, the crypto is approaching the edge of a structure while a breakout remains distinct. Therefore, the GRT price may trade around $0.11 to $0.12 by the end of the week.
Read More: Ocean Protocol Price Prediction
The Graph Price Prediction for August 2023
The GRT prices displayed the probability of maintaining a fine upswing throughout the month as they broke out from the bearish pattern initially. Unfortunately, the trend flipped and began to drop and is currently trading close to July lows. The current trade setup indicates the price experiencing extreme compression, which may result in a breakout that may largely depend on the volume induced.
The current week could remain consolidated within a narrow margin, and a bullish breakout may be expected in the first few days of the coming week. However, during the second half of the month, the price is believed to maintain a healthy upswing and rise above the interim resistance at around $0.136. Regardless of the bearish pressure, the GRT price may close the monthly trade between $0.14 to $0.15.
The Graph Price Prediction 2023-2024
Similar to the other cryptos, the Graph price maintained a steep bearish trend after facing rejection in the first few days of 2023. The price continued to form consistent lower highs and lows, displaying the growing strength among the bears. However, the price is flashing the possibility of a bullish rebound which may settle the yearly trade on a bullish note. The GRT price could close the 2023 trade, hovering between $0.7 to $0.92.
The price may begin the 2024 trade on a bullish note, rise beyond the pivotal resistance at $0.3, and reach $0.35 by the end of Q1. The bulls after rising the levels by more than 65% may get exhausted, allowing the bears to shed some of the gains. Further, with the beginning of the second half, the price may rebound and lay down a fine upswing. By the start of the fourth quarter, the GRT price may trigger a healthy bull run and close the yearly trade around $1.95 to $2.12.
GRT Price Prediction 2023-2050
| Year | The Graph Price Forecast |
| 2023 | $0.7 to $0.92 |
| 2024 | $1.95 to $2.12 |
| 2025 | $2.6 to $3.5 |
| 2026 | $1.4 to $1.8 |
| 2030 | $5 to $6 |
| 2040 | $12 to $15 |
| 2050 | $20 to $25. |
The Graph Technical Analysis
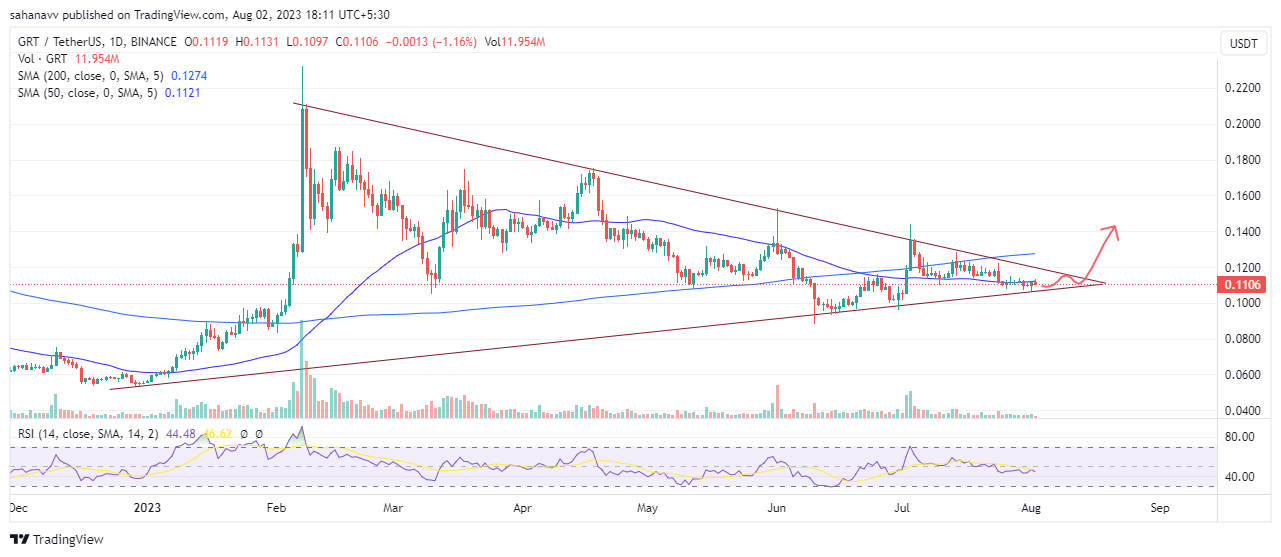
Source: Tradingview
- The GRT price is trading within a decisive symmetrical triangle and trading very close to the apex
- The price is currently testing the 50-day MA levels in the daily timeframe and a break above these levels is mandatory to trigger a healthy upswing.
- Besides, the RSI is heading toward lower support which may cause the price to face an extended descending trend for another few days.
- However, the volume, despite being lower, remains in favor of bulls which suggests the price is preparing for a bullish breakout in the coming days, aiming to reach the 200-day MA at $0.1274, which is acting as a strong resistance at the moment.
Additional Read: Algorand Price Prediction
Will The Graph Price Rise Again in 2023?
The GRT token is among the cryptos which have been under tremendous bearish pressure since the beginning of the year. The bulls have been failing to lift the price above the bearish formation, which has squeezed the price to a large extent. However, the price may witness a significant breakout in the coming days, setting up a fine upswing for the rest of the year.
Futures Trading on CoinDCX App!
Futures trading is one of the most important and favorite products of CoinDCX. It lets you deal with future contracts which are derived from the underlying asset, like Bitcoin or Ethereum or any other crypto, instead of owning the actual crypto. It is considered complex but has many advantages compared to traditional or spot trading.
Therefore, download the CoinDCX app and register now!
FAQs
What will the Graph Token be worth in 2023? The GRT price will mark new highs in the coming days beyond $6 to $8 in 2030. The price is believed to display immense strength in the coming years and could also reach $10 very soon The Graph token has been considered a good investment option due to its immense strength. However, a deep analysis of the project and the price movements is imperative.What will the Graph Token be worth in 2023?
What will the Graph Token be worth in 2023?
Will the Graph Token ever hit $10?
Is the Graph Token a safe investment?
Related posts

Cardano Price Prediction 2024: Can the Chang Upgrade Trigger Rally to $1?
Cardano’s technical strength, and 2024 price predictions analyzed.

Sui Price Prediction 2024-2030 : Can SUI Price Touch $4 in 2025?
SUI price is struggling hard to lay down a strong bullish trend.