
Key Takeaways
- Fantom’s Current Status: Fantom price is trading at [current_prices pair=”BTCUSDT”], with a total market capitalization of $1.78 billion, driven by a circulating supply of 2.8 billion FTM. Recent market activity shows heightened volatility, suggesting potential for both short-term corrections and further gains.
- Market Performance: FTM price has experienced a 33.1% rise over the past 7 days, indicating a strong bullish momentum following its recovery from August lows. Despite a minor 0.5% drop in the last 24 hours, Fantom’s consistent growth has been supported by a significant 24-hour trading volume of $263 million.
- Technical Analysis: With the RSI reading at 71.47, signaling overbought conditions, and the MACD trending positively at +0.02, Fantom price remains in a strong technical position. The coin is trading above crucial support levels, with the 50-day EMA at $0.47 and the 200-day EMA at $0.52 acting as dynamic support.
- FTM Price Predictions: If the R3 Fibonacci resistance level at $0.68 is surpassed, Fantom price could aim for fresh highs between $0.8 and $1 by October. On the downside, the psychological support around $0.5, aligning with the 200-day EMA, could act as a buffer against price drops.
- Future Outlook: The positive market sentiment, driven by strong buying activity, suggests Fantom may continue its bullish momentum. As the fear-greed index points to a neutral reading of 54, there’s room for cautious optimism, especially with the potential for FTM to reach $1 before the end of October.
Where will Fantom Price Head Next?
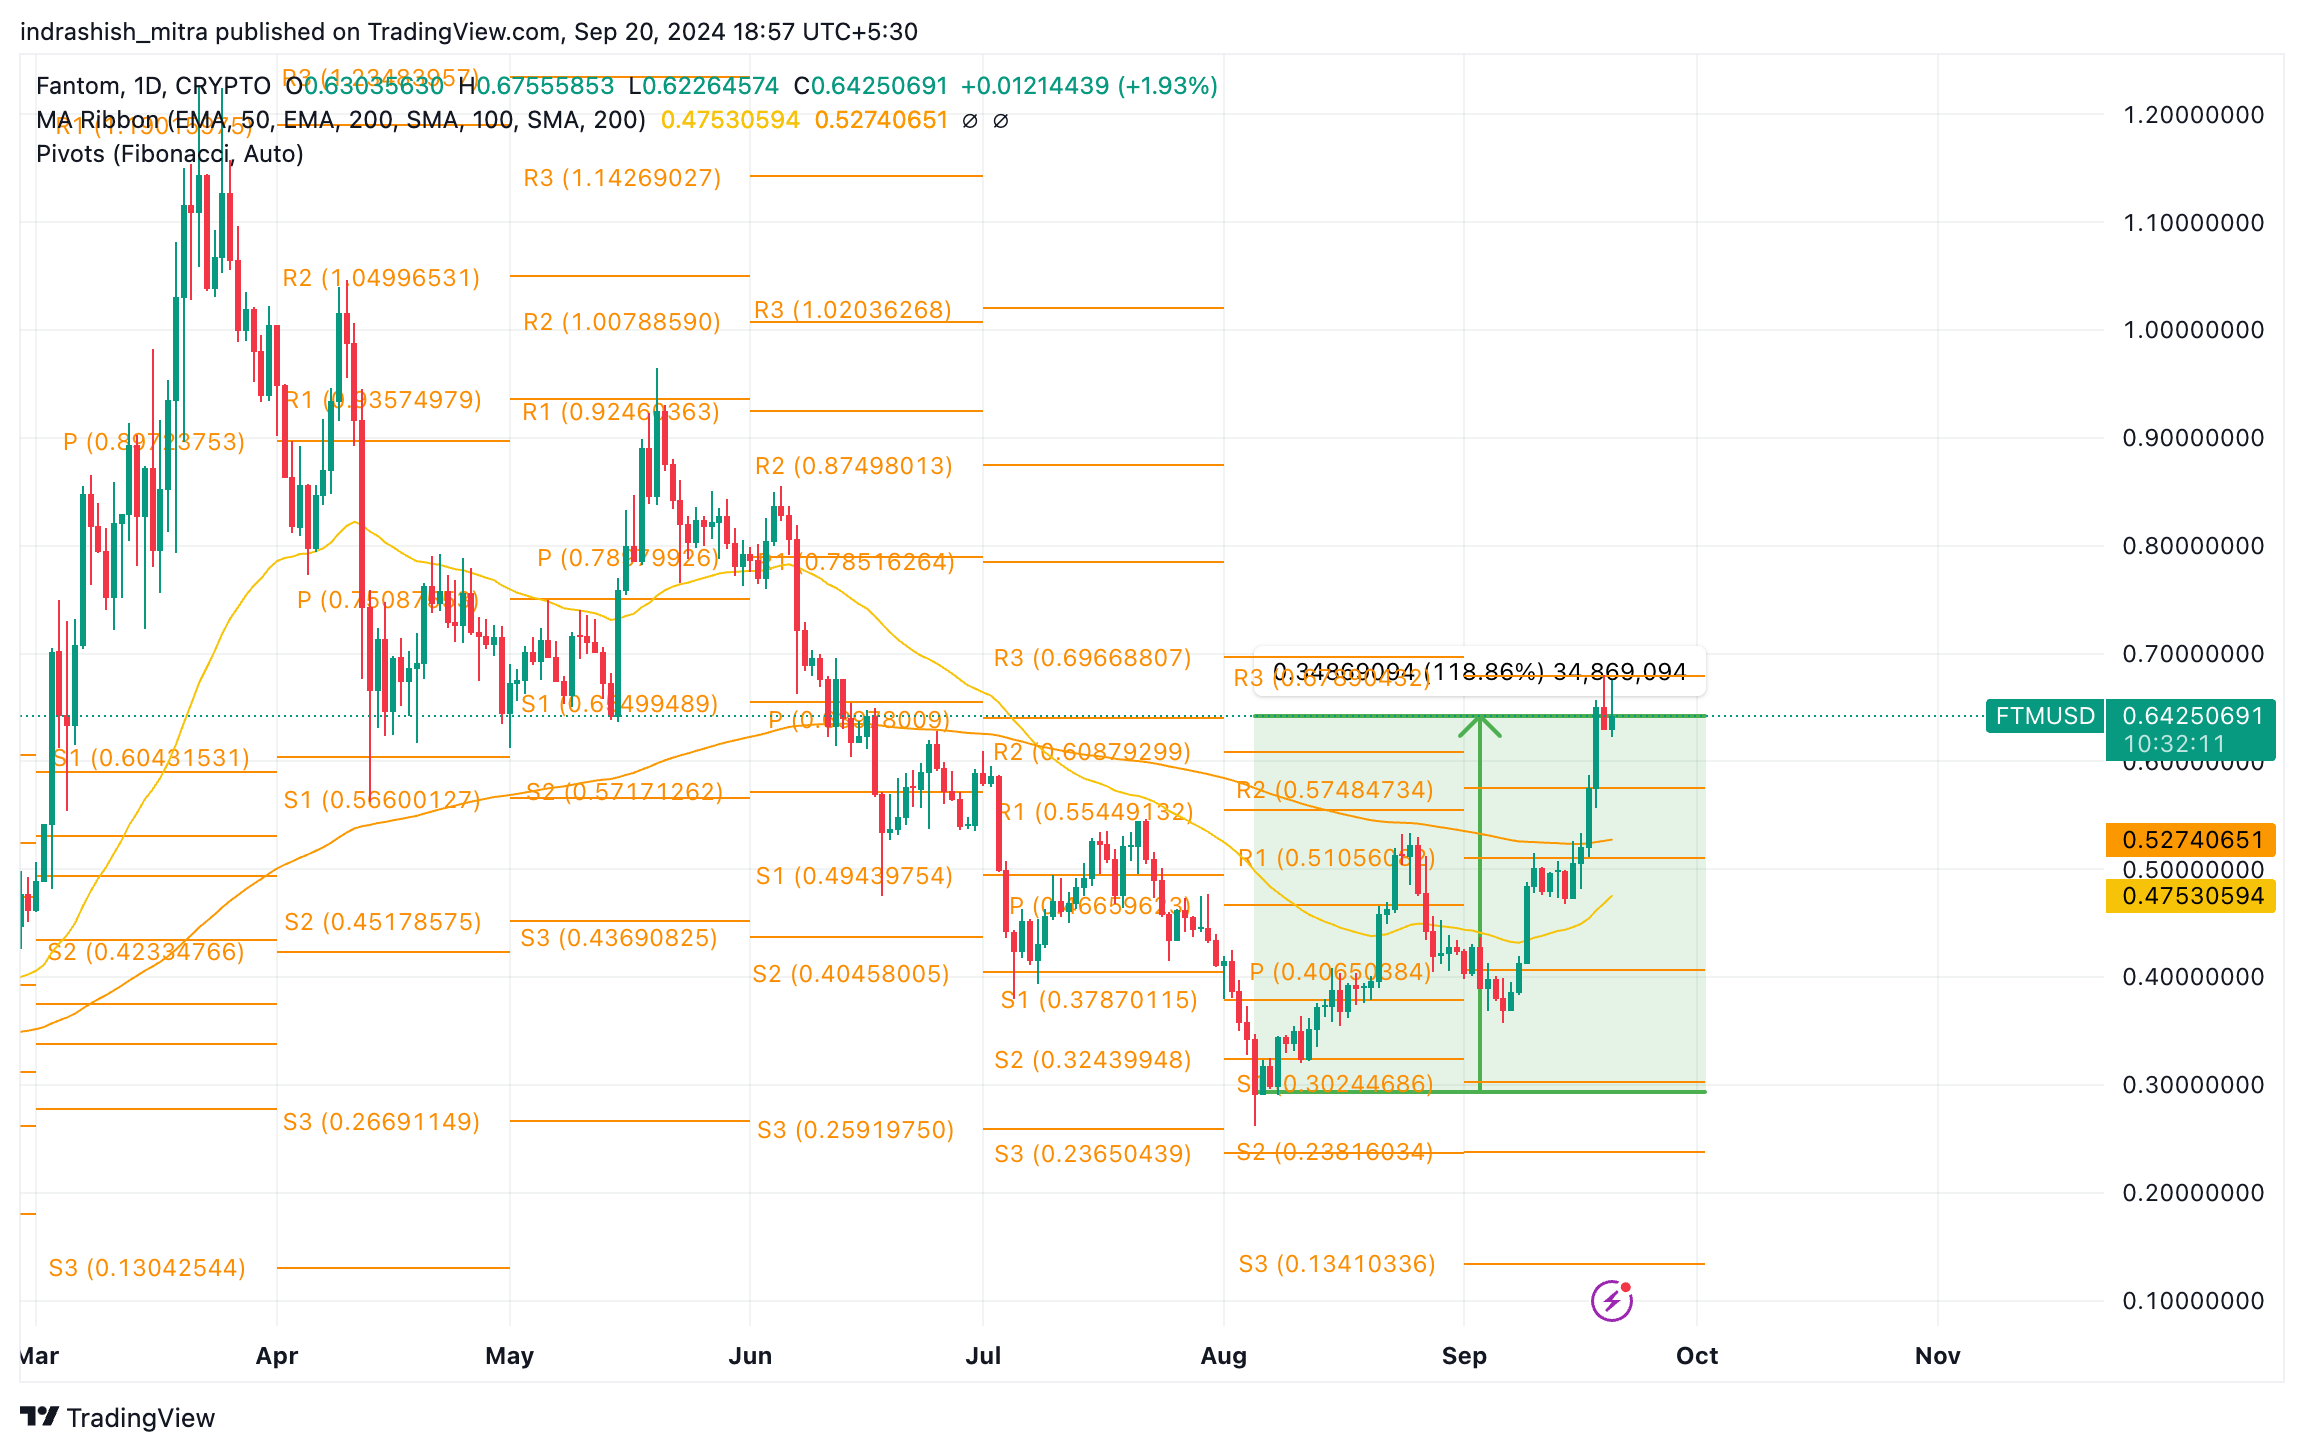
- While Fantom price has been on a downward trajectory ever since hitting a YTD high back in March 2024 – now that seems to be changing, with FTM price having more than doubled from August lows.
- FTM price has jumped nearly 120% from under $0.3 to over $0.64 as of writing this article, backed by significant trading volumes, indicating strong buying behaviour coming in.
- On the upside, once the R3 Fibonacci level for September is breached near $0.68, we can see fresh targets of $0.8 and even upto $1 before the end of October 2024.
- On the downside, the crucial psychological level at $0.5 should serve as a support zone, which also roughly aligns with the 200-day exponential moving average.
| Indicator | Value |
|---|---|
|
Support levels (Fibonacci, S1/S2/S3)
|
$0.3 / $0.23 / $0.13 |
|
Resistance levels (Fibonacci, R1/R2/R3) |
$0.51 / $0.57 / $0.68 |
|
50-day EMA |
$0.47
|
|
200-day EMA |
$0.47
|
|
RSI level |
71.47 |
|
MACD level (Signal Line) |
0.02 |
Fantom Price Prediction September 2024
Fantom price for September 2024 is forecasted to range between $0.65 and $0.72. Early in the month, market sentiment may lean bearish as the price tests key support around the $0.65 level. This could be driven by lower trading volumes and consolidation as traders await further signals. However, towards the end of September, the uptober narrative may inject optimism, allowing for a recovery and a potential test of the $0.72 resistance level. The 50-day moving average could serve as dynamic support, while the Relative Strength Index (RSI) may signal oversold conditions, potentially triggering a reversal. Overall, the month could end with bullish momentum setting the stage for a more optimistic outlook in October.
October 2024 could see one of the strongest rallies in Fantom price, with it likely testing the $1 psychological barrier. The price range of $0.85 to $1 represents a crucial breakout zone, particularly with the general excitement in the broader crypto market. Increased buying pressure and volume could push FTM price above its 200-day moving average, signaling a continuation of the bullish trend. Technical indicators such as the Moving Average Convergence Divergence (MACD) may turn more positive, adding further confidence to traders. However, short-term resistance could form around $1.1, where profit-taking might cool off the rally temporarily.
November 2024 could maintain the bullish momentum seen in October, with Fantom price projected to move within a range of $1.1 to $1.4. The spillover effect from “Uptober” may continue, potentially pushing FTM price to new year-to-date highs. Fibonacci retracement levels suggest $1.4 as a key resistance point, and any break above this could signal further gains. On the downside, strong support near $1.1, backed by both technical levels and increased investor interest, is expected to hold. Momentum indicators like the RSI may begin to flash overbought levels, signaling that a consolidation or mild pullback could be on the horizon.
December 2024 may bring a slightly more subdued performance for Fantom price after two consecutive bullish months. The price is expected to range between $1.3 and $1.5, with the $1.5 level acting as a strong psychological resistance for FTM price. Trading volume may decrease as the year comes to a close, leading to a period of consolidation. RSI levels could enter overbought territory, further confirming the likelihood of a short-term correction. However, technical support near $1.3, possibly bolstered by the 100-day moving average, is likely to hold. Despite softer momentum, the year-end price could still reflect significant growth compared to earlier in 2024.
Fantom Price Prediction 2025
In 2025, Fantom price could continue its upward trajectory, potentially ranging between $2 and $3. This growth would be fueled by increased adoption of Fantom’s DeFi infrastructure, along with broader blockchain market expansion. Technical indicators like the Moving Average (MA) and Fibonacci retracement levels could show key resistance around $2.5, with support potentially forming near $2. As adoption increases and more dApps are built on Fantom’s network, the MACD may signal further bullish momentum. Traders should watch for potential pullbacks, especially if market sentiment fluctuates or if macroeconomic conditions affect the crypto space.
By 2026, Fantom price could range between $3.5 and $4.5, as it benefits from mainstream crypto adoption and further network upgrades. The 200-day Exponential Moving Average (EMA) could indicate a continued uptrend, with key support levels forming around $3.6. Resistance near $4.5 may present a challenge, especially as the market faces increasing competition from other layer-1 blockchains. Technical analysis could show an extended bullish trend, though RSI indicators might suggest overbought conditions at times, leading to potential corrections. Overall, Fantom’s solid technical fundamentals and growing ecosystem will likely drive sustained interest in the coin.
Fantom price could see a climb to between $5 and $6.5 by 2027, driven by innovations in decentralized applications (dApps) and cross-chain functionality. The Fibonacci retracement levels might indicate resistance at $6, with support holding around the $5 mark. The MACD and RSI are likely to show bullish indicators, although potential regulatory developments in the crypto space could introduce volatility. Traders might also see ascending triangle patterns on the charts, signaling further potential breakouts. Despite possible fluctuations, Fantom’s long-term technical outlook remains positive as it continues to enhance its decentralized finance (DeFi) offerings.
In 2028, Fantom price could range between $6.5 and $8, bolstered by further DeFi adoption and partnerships. The asset’s performance will likely depend on market sentiment and technological advancements. Key resistance levels around $7.5 may serve as psychological hurdles, while support could be seen near the $6.5 level. Moving averages, particularly the 50-day and 200-day EMAs, may signal bullish continuation, with potential for overbought RSI conditions suggesting periodic pullbacks. Fantom’s expansion into new sectors like gaming or NFTs could provide further upside, attracting both institutional and retail investors to its platform.
By 2029, Fantom price may rise between $8.5 and $10.5, reflecting continued maturation of its platform and the overall crypto ecosystem. Technical patterns, including bullish flags and channels, may form, suggesting upward price momentum. Fibonacci retracement levels around $9 could act as resistance, with support building near $8.5. As the blockchain space evolves and gains global traction, Fantom price’s real-world use cases and partnerships will be critical to its price action. Long-term moving averages will likely show sustained growth, although traders should be cautious of potential macroeconomic disruptions or regulatory changes.
In 2030, Fantom price could range between $11 and $14, driven by mainstream blockchain adoption and possible new market segments. With technical indicators like MACD and RSI showing strong bullish trends, key resistance at $13.5 could be a challenge, though the growing use of DeFi and smart contracts on Fantom’s platform may push the asset higher. The 200-day EMA may confirm a solid uptrend, while shorter-term moving averages may point to continued bullish sentiment. However, potential challenges in global regulation or market saturation could introduce volatility, so traders should remain vigilant.
Will Fantom Price Continue to Rise in 2024?
Fantom price is likely to continue its upward movement through the rest of 2024, largely driven by improving technical indicators and increasing network activity. The “Uptober” momentum could see Fantom testing resistance levels around $1 by the end of the year. However, short-term corrections may occur, especially as traders look to lock in profits. The MACD and RSI could show signs of bullish divergence, while Fibonacci levels may offer both support and resistance points to monitor. Overall, the outlook for 2024 remains positive, with solid growth anticipated for the remainder of the year.


