Introduction
In the fast-paced world of crypto trading, understanding and using technical indicators can be the difference between success and failure. Among these indicators, the Moving Average Convergence Divergence (MACD) stands out as one of the most reliable and widely used tools by traders across all financial markets, including cryptos. This comprehensive guide will delve into what the MACD indicator is, how it functions, and how you can effectively use MACD in trading to make informed decisions in the crypto market.
What is MACD?
MACD, or Moving Average Convergence Divergence, is a trend-following momentum indicator that shows the relationship between two moving averages of a security’s price. Developed by Gerald Appel in the late 1970s, the MACD in trading is used to identify changes in the strength, direction, momentum, and duration of a trend in a crypto price.
Components of MACD
The MACD indicator is comprised of three key components:
- MACD Line: This is the difference between the 12-day Exponential Moving Average (EMA) and the 26-day EMA. The MACD line is the foundation of the MACD indicator and reflects the momentum of the asset.
- Signal Line: This is the 9-day EMA of the MACD line. The signal line acts as a trigger for buy and sell signals. When the MACD line crosses above the signal line, it generates a bullish signal, suggesting that it might be a good time to buy. Conversely, when the MACD line crosses below the signal line, it generates a bearish signal, indicating that it might be time to sell.
- Histogram: The histogram is the difference between the MACD line and the signal line. It visually represents the momentum of the asset, showing the strength of the buy or sell signals. When the bars on the histogram are above the zero line, it indicates bullish momentum, and when they are below, it indicates bearish momentum.
How to Use MACD in Crypto Trading
Using the MACD in trading involves understanding how to read its signals and apply them to your trading strategy. Below are several methods to use the MACD indicator effectively in crypto trading.
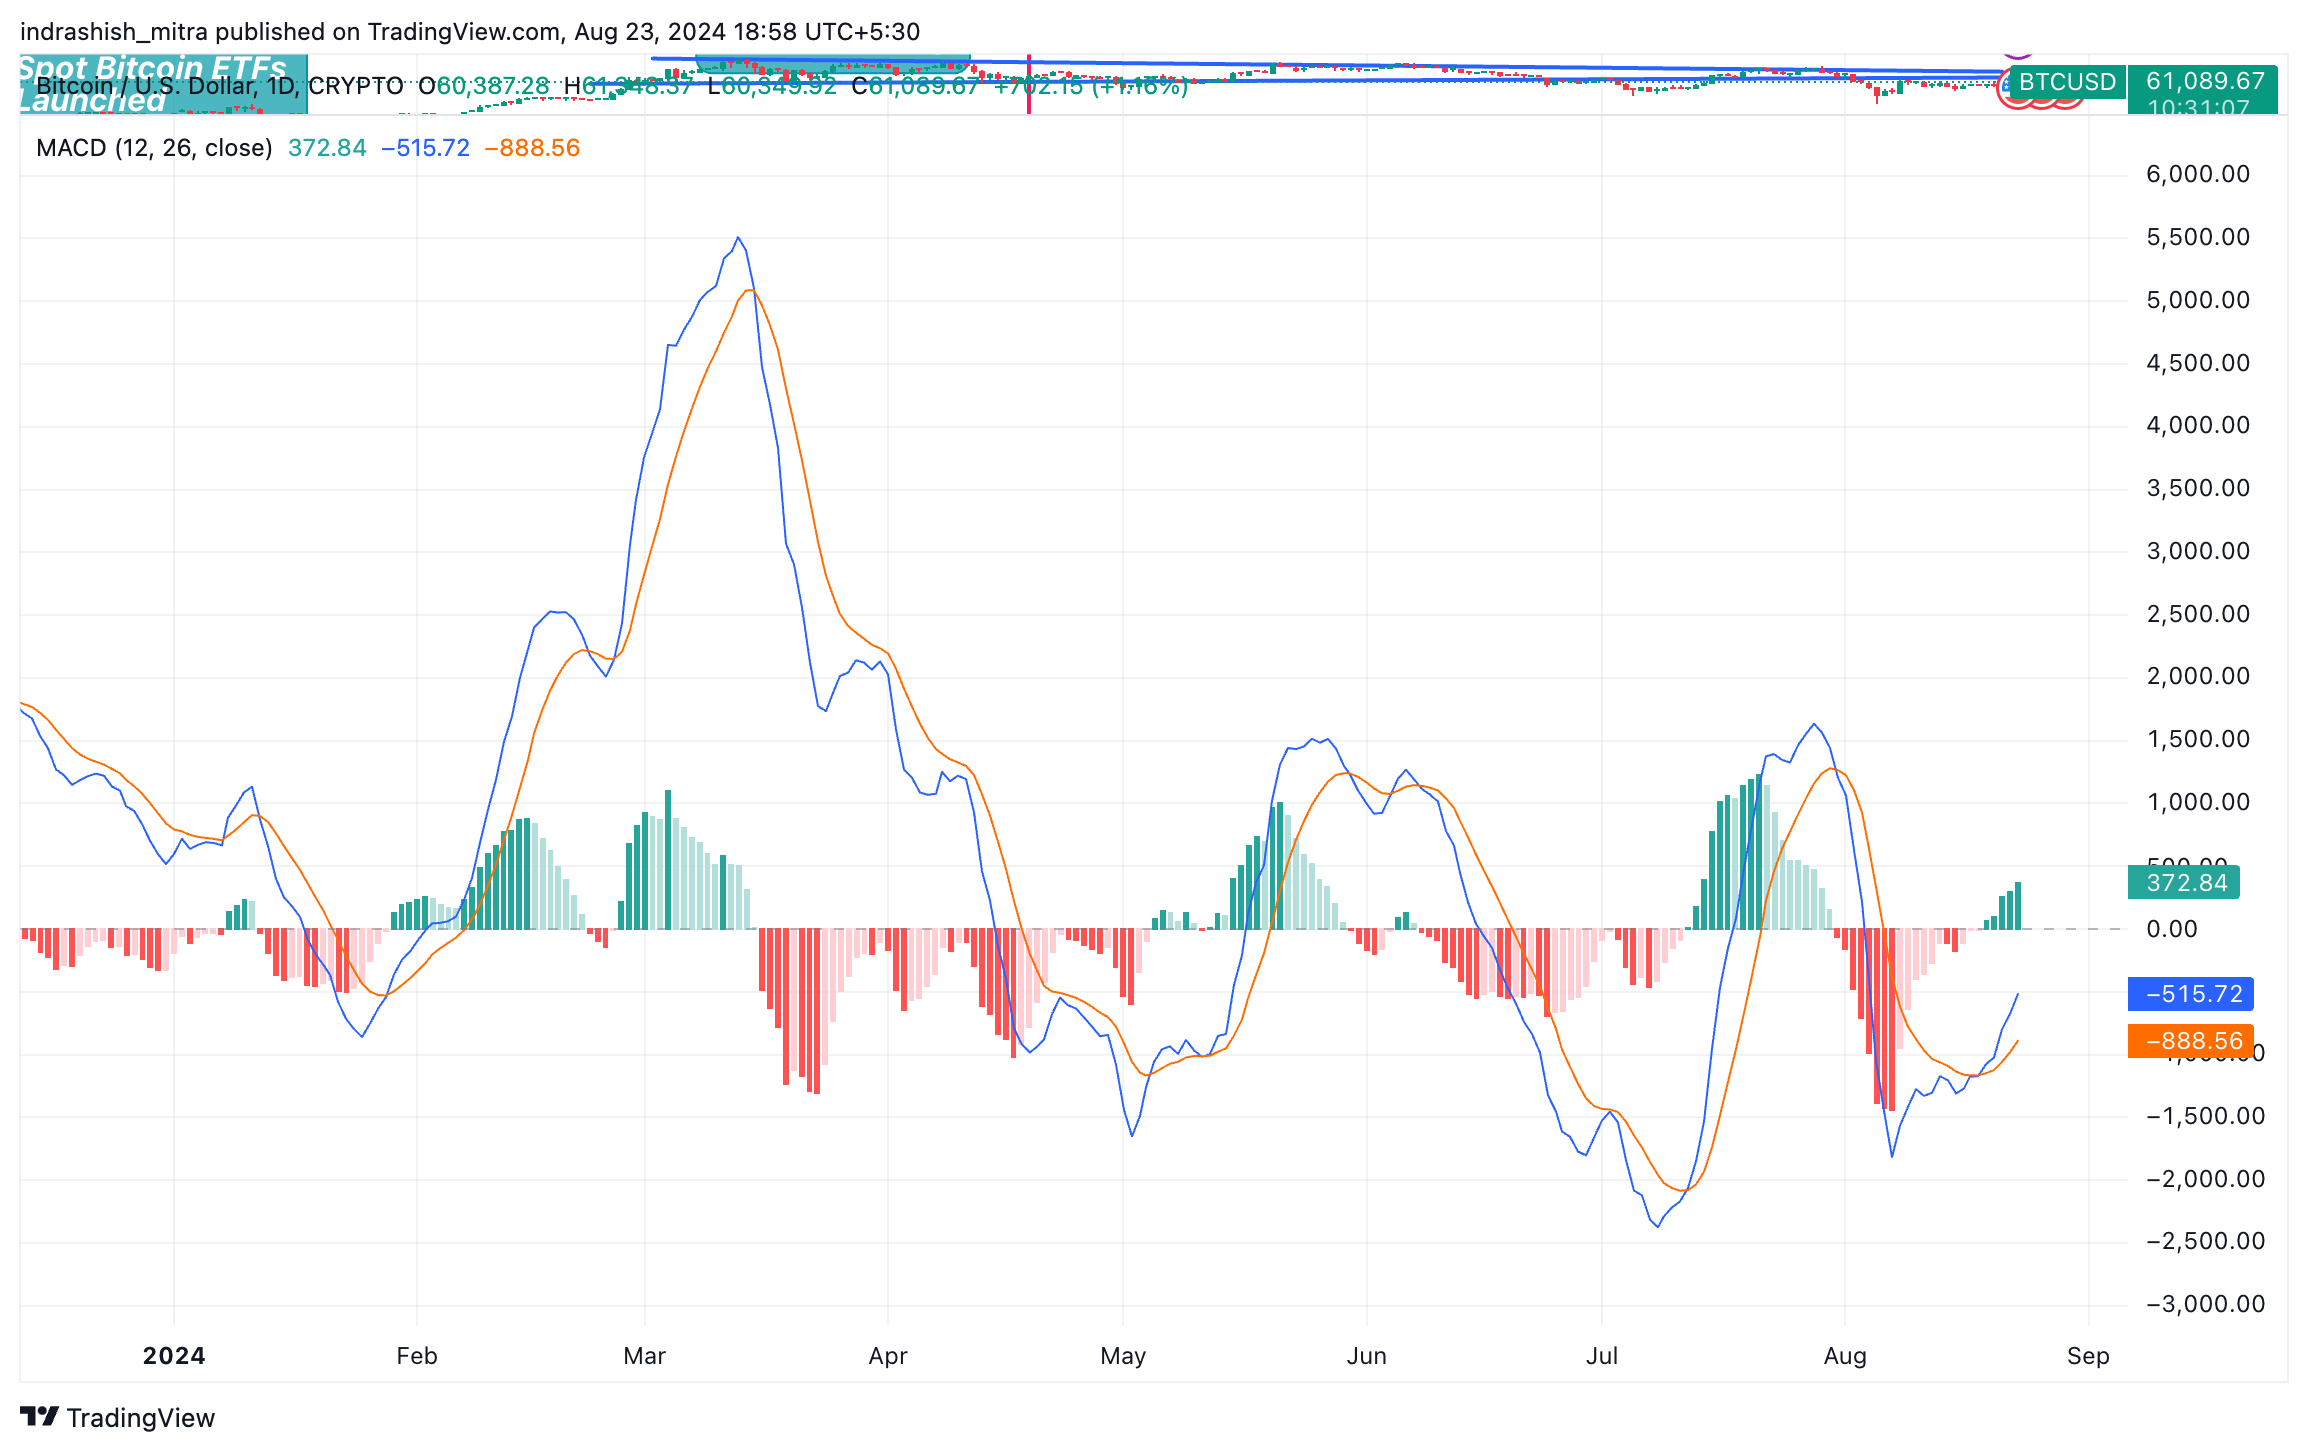
Sample of MACD Indicator for BTC/USD | Source: TradingView
1. MACD Line and Signal Line Crossovers
One of the primary ways traders use the MACD indicator is by observing the crossovers between the MACD line and the signal line.
- Bullish Crossover: When the MACD line crosses above the signal line, it is considered a bullish signal. This crossover indicates that the short-term momentum of the crypto asset is stronger than the longer-term momentum, signaling a potential uptrend. For instance, if Bitcoin’s MACD line crosses above its signal line after a period of consolidation, it might suggest that Bitcoin is about to break out to the upside.
- Bearish Crossover: Conversely, when the MACD line crosses below the signal line, it is a bearish signal, suggesting that the short-term momentum is weaker than the longer-term momentum. This signal can indicate a potential downtrend, making it a good time to consider selling or shorting the asset.
2. Histogram Analysis
The MACD histogram is another crucial component in MACD trading. Traders often use it to identify the strength of the trend.
- Increasing Histogram Bars: When the bars on the histogram are getting longer in the positive direction, it indicates that the bullish momentum is increasing. This can be a strong signal that the price will continue to rise.
- Decreasing Histogram Bars: Conversely, when the bars are getting shorter or moving into the negative territory, it suggests weakening momentum and can indicate a reversal or a downtrend.
For example, if Ethereum’s MACD histogram starts showing longer positive bars, it might indicate that the bullish trend is strengthening, and the price could continue to rise.
3. Divergence
Divergence between the MACD line and the price of the crypto is a powerful signal that often precedes a reversal.
- Bullish Divergence: Occurs when the price of the crypto is making lower lows while the MACD line is making higher lows. This divergence suggests that the downtrend is losing momentum and a reversal to the upside might be imminent. For instance, if the price of Ripple is falling, but the MACD is rising, this could indicate that the selling pressure is diminishing, and a price increase could follow.
- Bearish Divergence: This happens when the price is making higher highs, but the MACD line is making lower highs. This divergence suggests that the uptrend might be losing strength, and a reversal to the downside could be on the horizon. If Litecoin’s price is rising but the MACD starts to decline, it could be a warning that the uptrend is nearing its end.
Learn More: What are Bollinger Bands?
Examples of Using MACD in Crypto Trading
To better understand how to apply MACD in trading, let’s look at a couple of examples in crypto trading.
Example 1: Bitcoin Bullish Crossover
In early 2021, Bitcoin was in a strong uptrend, but there were periods of consolidation where the price moved sideways. During one of these periods, the MACD line crossed above the signal line, indicating a bullish crossover. This signal was a precursor to the next leg up in Bitcoin’s price, as the bullish momentum resumed, and Bitcoin went on to reach new all-time highs.
Example 2: Ethereum Bearish Divergence
In mid-2021, Ethereum experienced a sharp rally, reaching new highs. However, during the later stages of the rally, the MACD line started making lower highs, while the price of Ethereum continued to rise. This bearish divergence signaled that the uptrend was losing steam, and soon after, Ethereum’s price began to decline.
Know More: Crypto Fear & Greed Index Explained
Combining MACD with Other Indicators
While MACD is a powerful indicator on its own, its effectiveness can be enhanced by combining it with other technical analysis tools. Here are a few examples:
- MACD and RSI (Relative Strength Index): The RSI is another momentum indicator that measures the speed and change of price movements. Combining MACD with RSI can help confirm signals. For example, if both MACD and RSI indicate overbought conditions, it can strengthen the case for a potential price reversal.
- MACD and Moving Averages: Some traders use MACD in conjunction with simple or exponential moving averages to confirm trends. For instance, if the MACD shows a bullish crossover and the price is above the 50-day moving average, it might be a stronger signal to buy.
- MACD and Fibonacci Retracement: Fibonacci retracement levels can act as support and resistance levels. If the MACD indicates a bullish signal and the price is at a key Fibonacci support level, it might be a good entry point.
Advantages and Limitations of MACD in Trading
Advantages
- Versatility: MACD can be used in different market conditions, whether trending or ranging, making it a versatile tool in a trader’s arsenal.
- Momentum and Trend: MACD provides insights into both momentum and trend, giving traders a comprehensive view of the market.
Limitations
- Lagging Indicator: Since MACD is based on moving averages, it is a lagging indicator. This means it might provide signals after the price has already moved significantly.
- False Signals: In choppy or sideways markets, MACD can produce false signals, leading to potential losses.
Read On: Top Crypto Technical Indicators
Conclusion
The Moving Average Convergence Divergence (MACD) is an essential tool for any crypto trader. Understanding how to use MACD in trading can provide valuable insights into market momentum and potential trend reversals, helping traders make more informed decisions. While MACD is powerful, it is most effective when used in conjunction with other indicators and proper risk management strategies. By mastering the MACD indicator, crypto traders can enhance their ability to navigate the volatile and unpredictable world of crypto trading.
Related posts

Understanding the Different Types of Cryptos: Coins, Tokens, Altcoins & More Explained
Explore the major types of crypto assets and their unique roles.

PAWS Telegram Game: The New Tap to Earn Game That Is Beating Hamster Kombat
Discover how to play and earn with PAWS Telegram game.