
INTRODUCTION
Technical analysis is a big part of any kind of analysis of the price of an asset. This is because, out of all the indicators a trader or an investor can use in the market – price is the only one that is said to be a leading indicator. All others are simply derivatives of price and thus, are lagging indicators. Now, since price is the only leading indicator out there, how can we use that data to make objective decisions in the live market? That is where technical analysis comes in and tries to help you out. While broadly, technical analysis includes all kinds of indicators, it is mainly the study to price to determine trends and help make good trading decisions in the live market. However, out of all the price-based technical analysis techniques – one of the most useful and popular ones is the concept of support and resistance.
So, what are Support and Resistance Zones in Crypto?
So the concept of support and resistance in trading can be looked at in a couple of ways. All of these ways ultimately point in the same direction, however – it is good to know the different variations that can play out so that at the heat of the moment, one is able to take the right action in the trade.
One way of looking at support and resistance zones is that these are regions of price on a chart that are typically where a lot of buy or sell orders are located, respectively. That means, a price level is considered to be a support level if there are a lot of buy orders at that price – which indicates that a lot of people are willing to buy a particular crypto asset at that specific price. On the other hand, a price level is considered a resistance level if there are a lot of sell orders at that price – which indicates that many people are willing to sell a particular crypto asset at that specific price. Thus, prices don’t tend to fall below support areas and prices aren’t able to breach past resistance levels easily.
The other way of looking at support and resistance level is through the concept of supply and demand. As a simple rule of thumb, if there is a lot of supply, price of any asset tends to fall; on the other hand, if there is a lot of demand, the price of that asset tends to rise. This is a simple concept from basic economics. So tallying that with the topic of our article here, a support is a region where there is a lot of demand in the market while at the same time a resistance is a region on the price chart where there is a lot of supply. Hence, prices tend to fall below resistance levels and stay above support levels.
Thus, in conclusion to this explanation, combining the two ways explained above – a support zone on the price chart is a region where there is a lot of demand for the asset under consideration, which means a lot of people are willing to buy that asset at that specific price level, since they feel it is an attractive valuation to buy the asset. This is why prices find it difficult to break down below support levels and usually tend to move upwards from there.
On the other hand, a resistance zone on the price chart is a region where there is a lot of supply for an asset, which means a lot of people are willing to sell their holdings at that specific price level, as they think it will become overvalued beyond that. This is why prices find it hard to break out of resistance levels and usually tend to move downwards from there.
Another thing to understand is that support and resistance on a price chart can be of various types. The first kind is that this support and resistance can be either zones or specific price levels. The second kind is that these need not be only horizontal in nature but can be diagonal on the price chart too. We’ll learn more about these different kinds of identifying support and resistance levels through a chart.
Read more: How to read Crypto Candlestick Charts
How to find support and resistance zones in crypto?
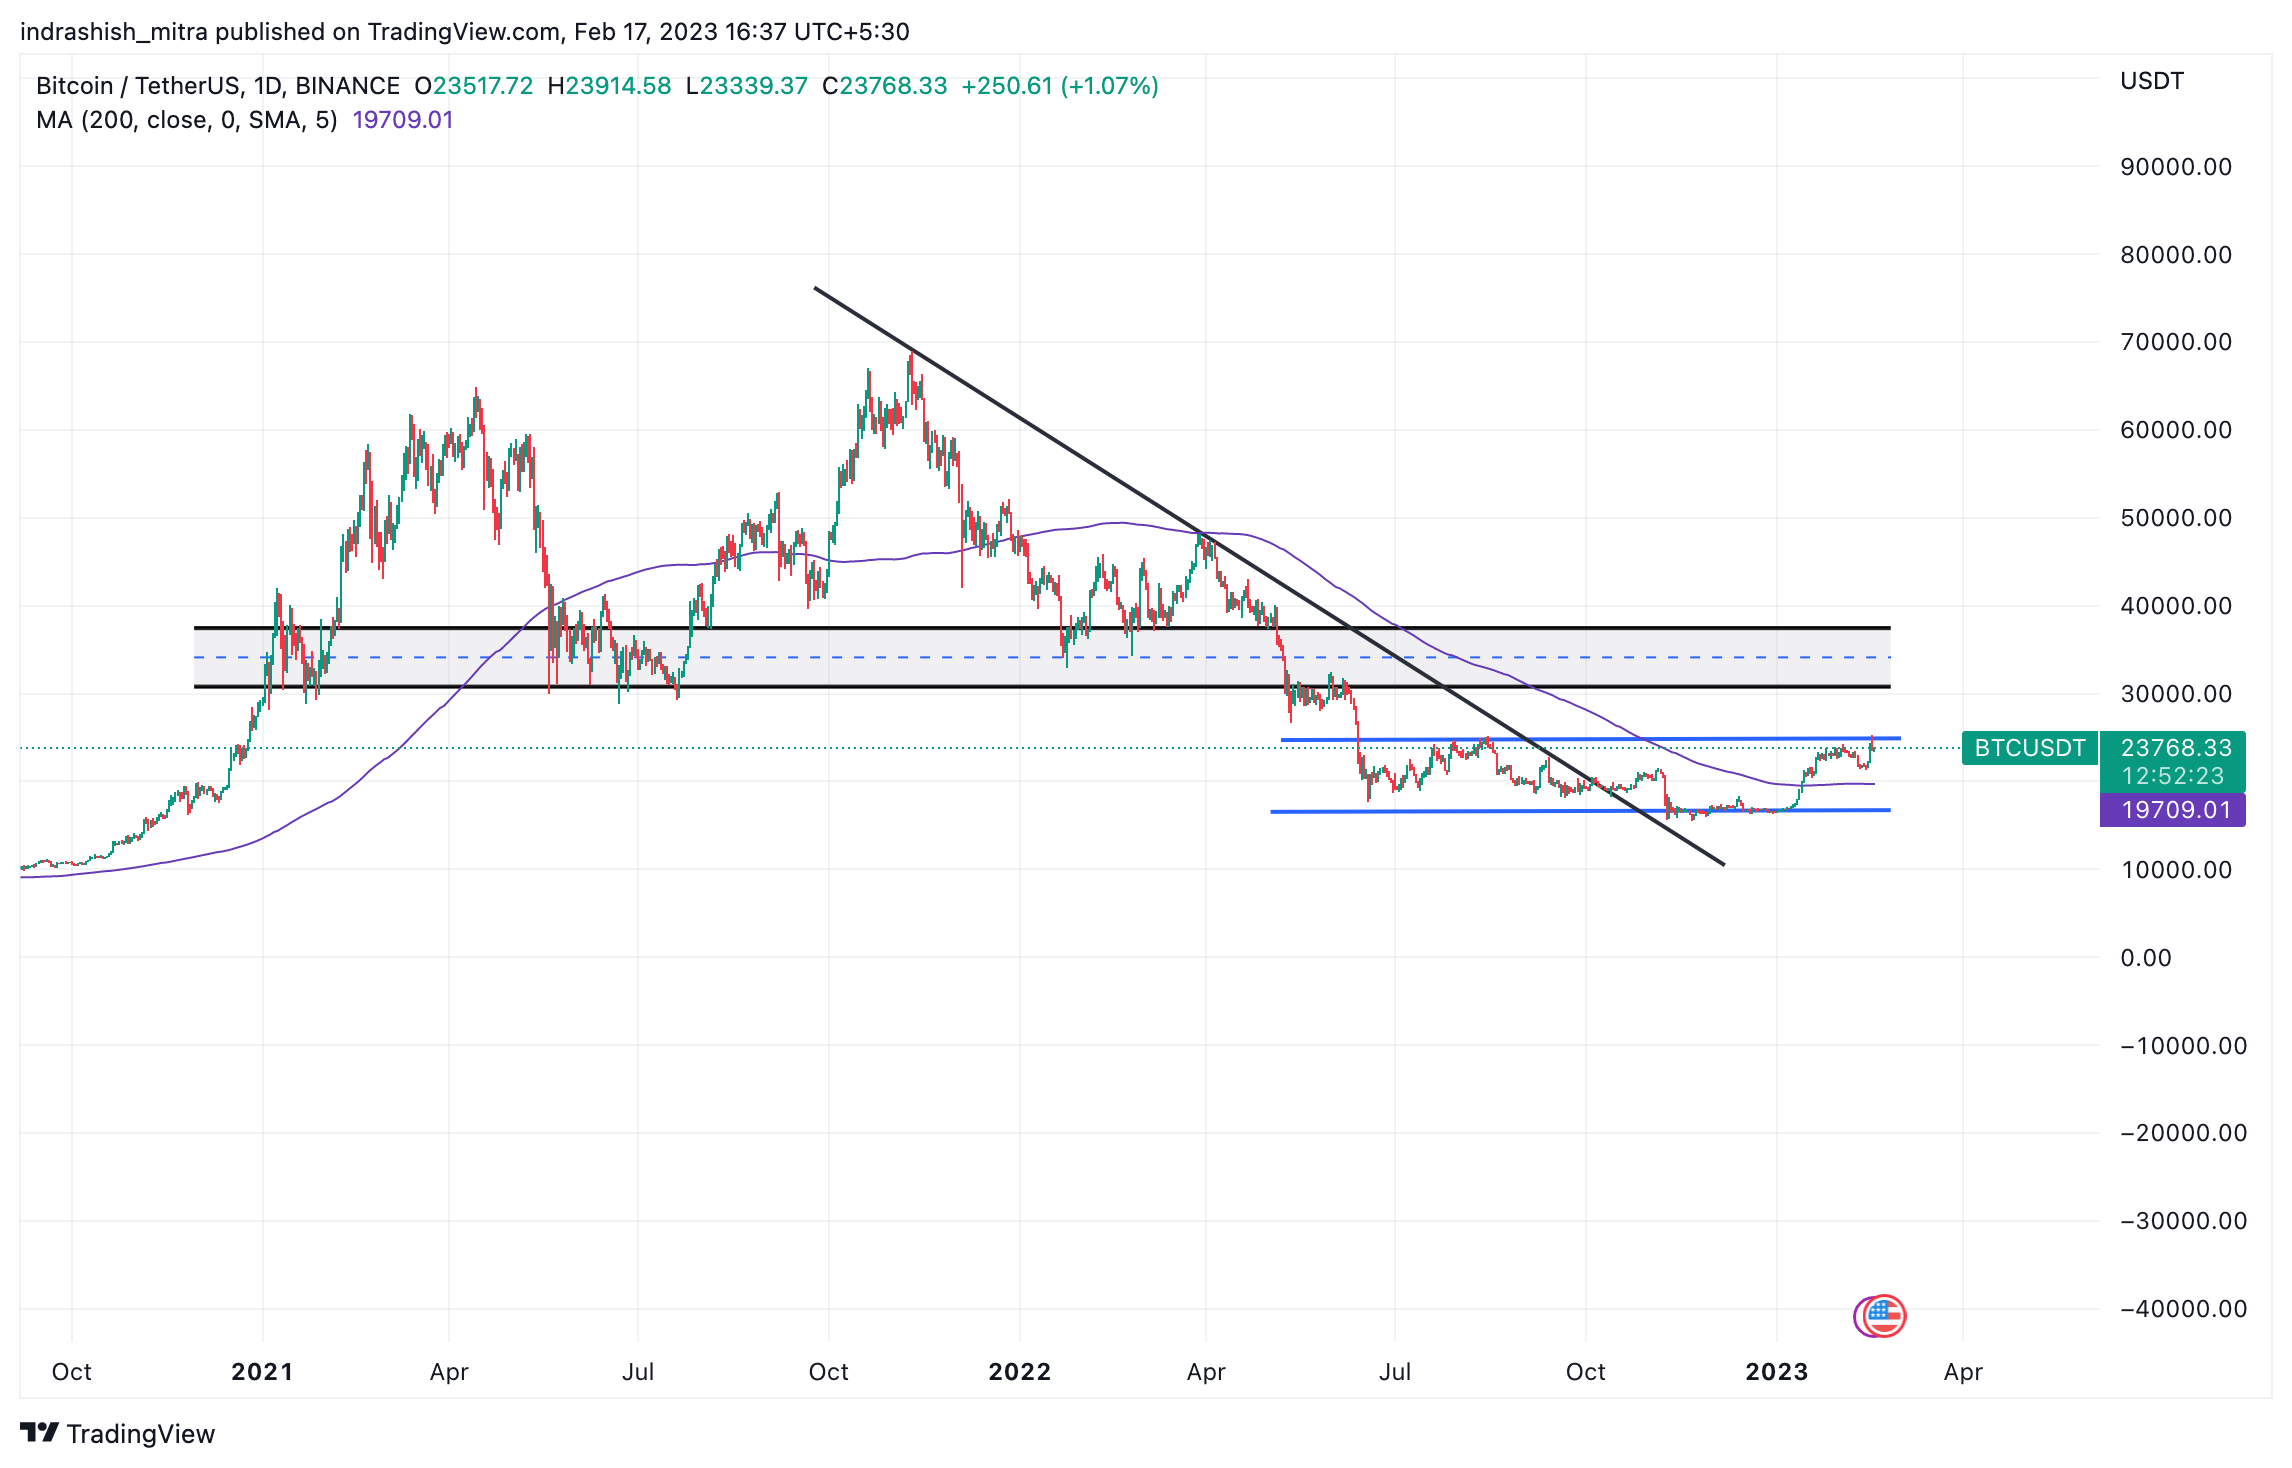
BTC/USDT | Source: Tradingview
On the chart, there are three broad kinds of support and resistance levels marked and we will talk about all of them in detail.
Horizontal support and resistance lines
As the name shows, these are horizontal lines drawn on a price chart and represent a particular price level or a price region. These are typically drawn on the charts by connecting the highs and lows of a certain time duration and trying to identify and judge a direction or trend in price. On the chart above, we are looking at the two ways horizontal support and resistance lines can be used.
The first kind is the one where the horizontal lines are drawn to depict a single value of price. So the blue lines drawn on the chart represent this kind of horizontal support and resistance line – at around $19,700 and $24,600. The second kind is where these horizontal lines can be drawn to depict a region of support or resistance, as is demarcated with the parallel channel marked in grey. That indicates the grey zone between $30,000 and $30,700 can be expected to be a region of support or resistance.
Thus if there is a line above the current market price of an asset, it acts as a resistance for the price, however at the same time if that price is able to rally and breakout above it, then it flips to become a support for the same. This is application on the other side too, on a bearish trend if we see a line below the CMP, it acts as a support but if we see a breakdown below the line, then it flips to become a resistance level.
Trendlines
The next kind is trendlines. This is the kind of line drawn on a chart diagonally that depict a particular directional trend, while also at the same time serve as a region of support or resistance. On the chart above, a trendline drawn in black indicates a falling trend by connecting the lower highs created by BTC price between October 2021 to October 2022.
If the price action of an asset is below this line, one can expect some selling pressures to develop while if we see a convincing breakout over this line, it flips to become and act as a support for the prices. Thus from the chart, we can identify if a trendline connects candlestick lows, it acts as support and if it connects candlestick tops, it acts as resistance.
Read more: How to use and draw trend lines in Crypto Trading?
Moving averages
The next method which can help you identify some support and resistance levels are moving averages. Moving averages are essentially lagging technical indicators that smooth out past price movement data to help traders identify trends. They also represent locations of support and resistance zones. Similar to the above methods, if the price is trading above the moving average it acts as support and if the price is below the moving average it acts as resistance. The long-term moving average support and resistance levels are usually stronger than the short-term ones – thus on the chart above you can find the 200 day moving average displayed for your reference.
Read more: How to trade crypto using Moving Averages?
How to Use Support & Resistance Zones in Crypto
The best and the most simplest way to use support and resistance zones in crypto trading is to identify these levels and making sure you don’t trade against these. For example, if you see a price falling and coming to a halt near a support, taking a short position at that point isn’t the best decision, and at the same time if you see a rally coming to a halt near a resistance level, going long also isn’t a good idea.
On the same vein, if you see prices breaking out of a resistance level convincingly can be an indicator for strong bullish momentum and a break down below a crucial support level can be an indicator for a strong bearish momentum in the price of the asset.
Conclusion
Thus, in conclusion, while support and resistance levels aren’t enough for you to take a trading decision simply based on them – these act as a very useful set of filters to help traders make better trading decisions in the heat of the moment. Becoming proficient at identifying support and resistance zones can help you avoid bad trades and enable you to save your capital to take advantage of a better opportunity that might come in later. All in all, it becomes very important for traders and investors to learn about support and resistance zones.
Related posts

Understanding the Different Types of Cryptos: Coins, Tokens, Altcoins & More Explained
Explore the major types of crypto assets and their unique roles.

PAWS Telegram Game: The New Tap to Earn Game That Is Beating Hamster Kombat
Discover how to play and earn with PAWS Telegram game.