
Introduction
Crypto trading is something that has been in the industry for quite some time now – however, it has only caught the mainstream attention as recently as 2021 – when we saw one of the biggest bull markets in the crypto market that resulted in a rally that took the overall crypto market up to near $3 trillion. Bitcoin, the king coin of the crypto market saw a rally all the up to $69,000 before falling back down in the following year, along with the rest of the market.
It is interesting to note however, due to this volatility and impressive range in prices, crypto markets have managed to provide significantly higher returns than any other financial product out there and amid the Covid-19 pandemic – when a lot of people lost their sources of income and jobs – the crypto market had come to their rescue.
With that in mind – crypto trading is something that many people across the world have forayed into, to put their free cash to use and make some returns that are in excess of what we usually see in the market from other instruments.
Types Of Trends
Before we get into trendlines, let’s first understand what trends are. An uptrend is a period where value of an asset can be observed to be continuously increasing. Similarly, on the flip side – a downtrend is a situation where the value of an asset is observed to be continuously decreasing.
The reasons behind the increase and decrease in value may be varied, but the final effect comes out in the actual value of the asset – which is why in technical analysis, price is considered to be the most leading indicator.
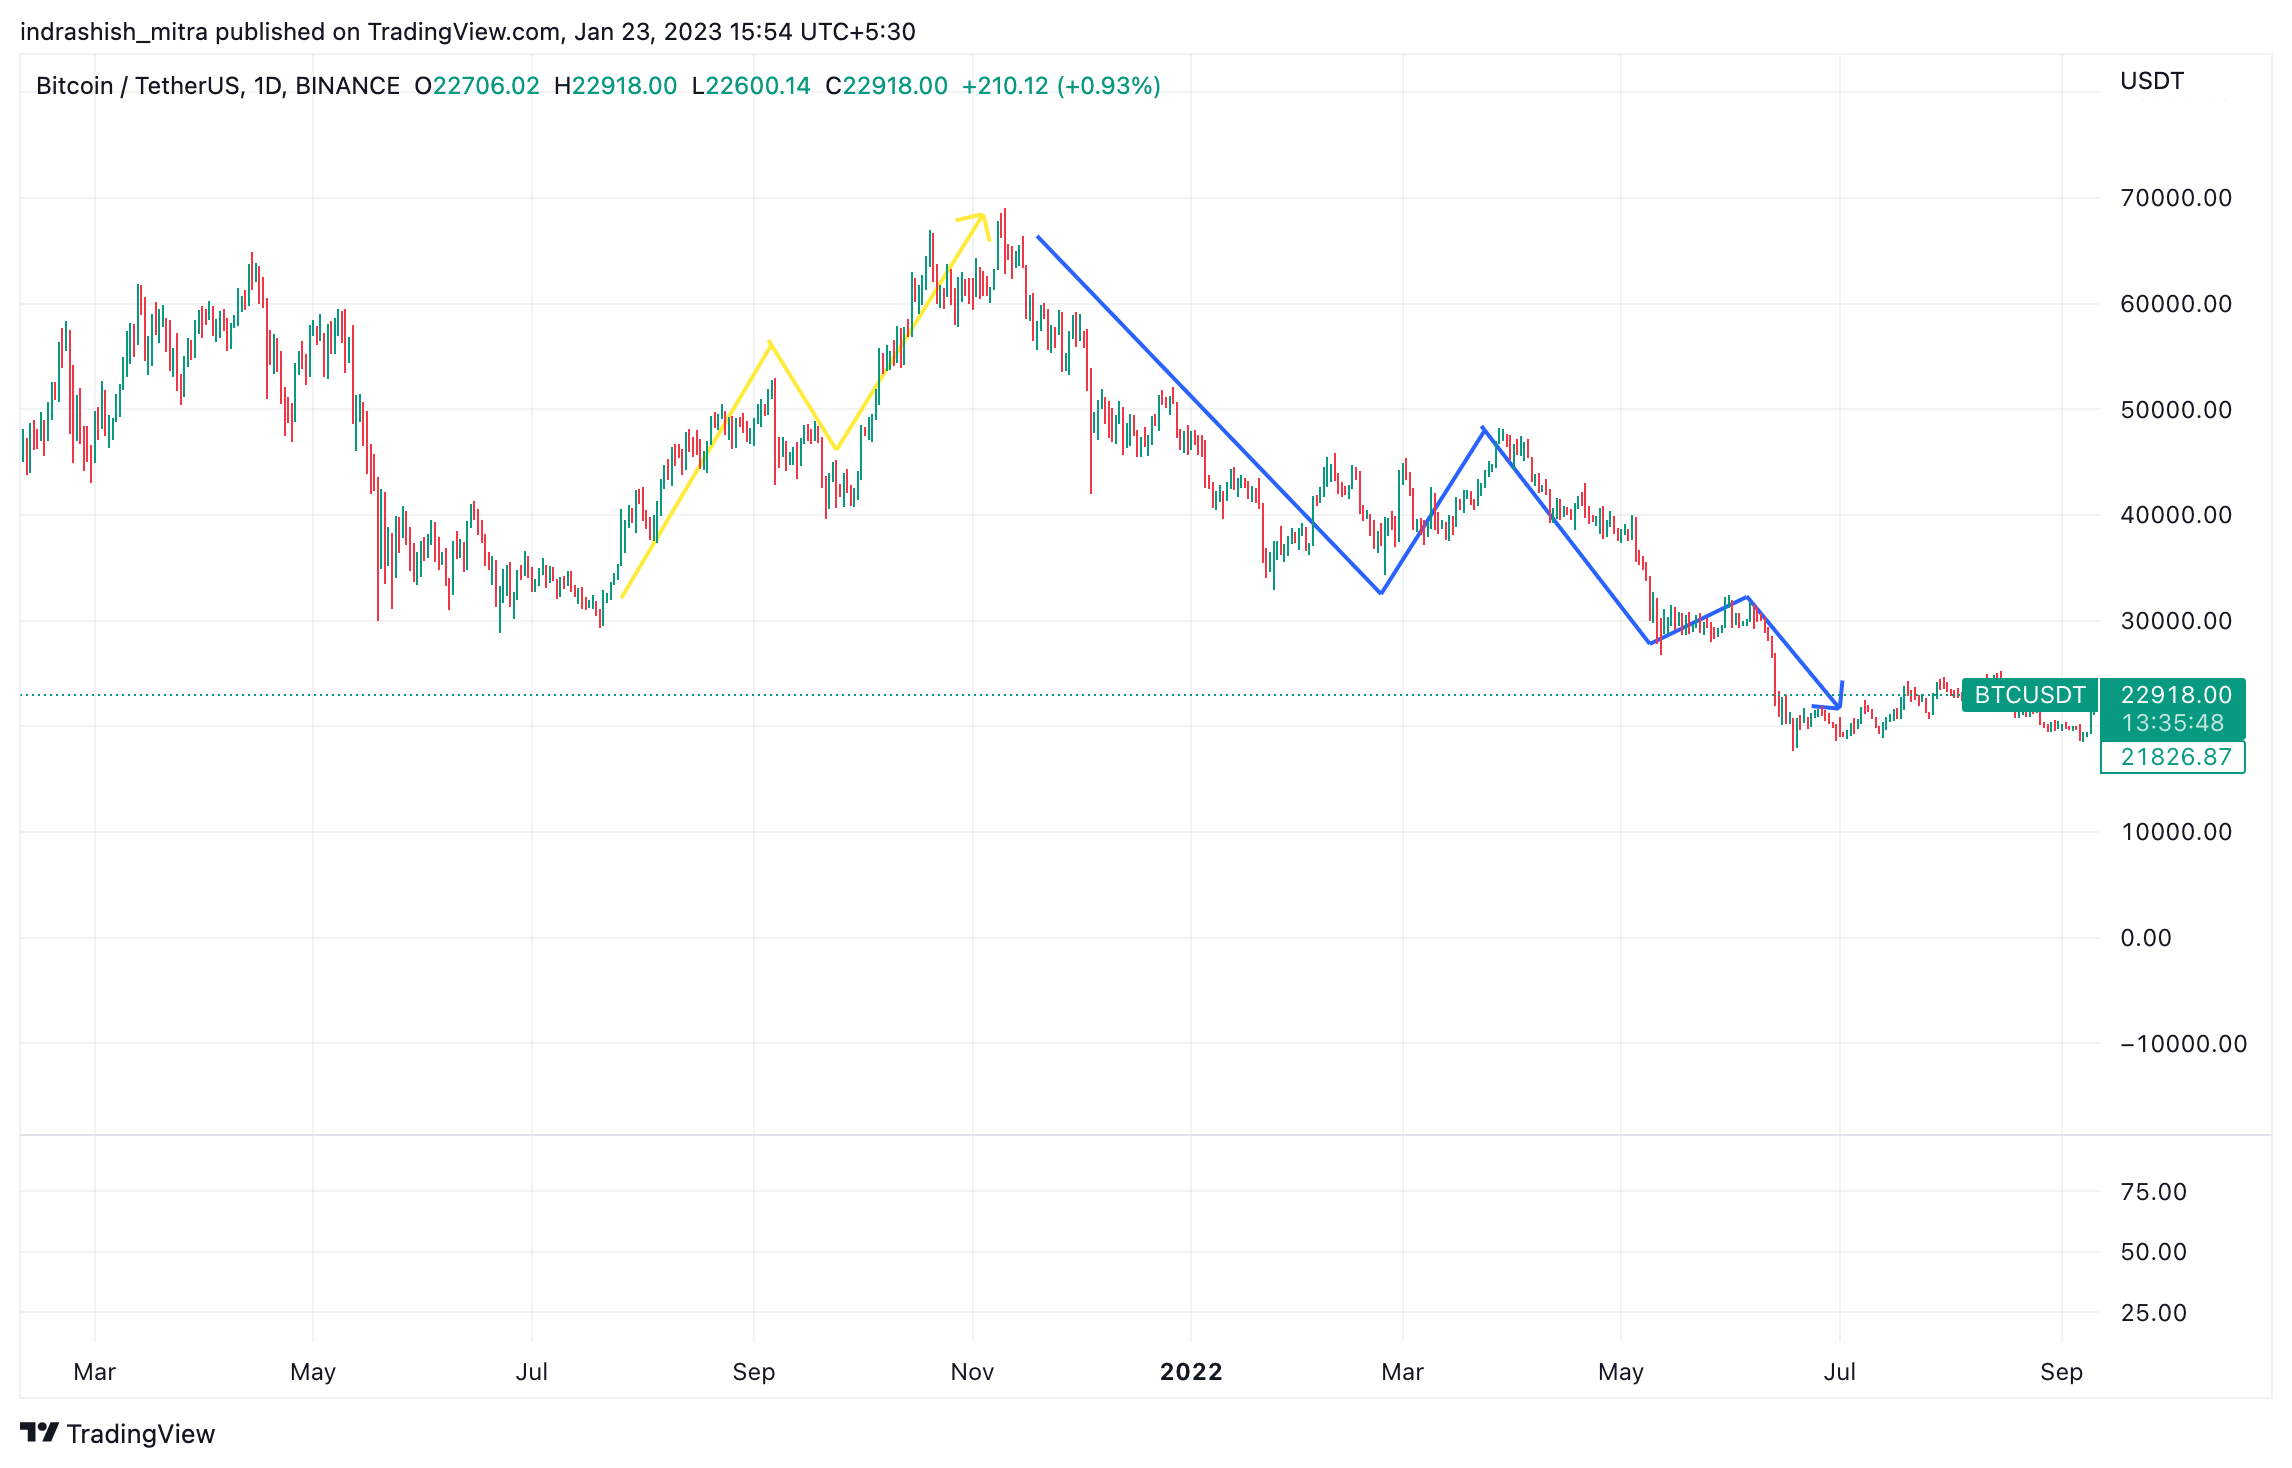
BTC/USDT | Source: Tradingview
As the name suggests, trendlines are lines drawn on price charts to determine the direction of a particular trend. It is made by connecting extreme points of a the trend. Typically, if prices are constantly moving on the upside, then the trendline will be slanted upwards. On the flip side, if the market is seeing selloffs, the trendline will be slanted downward.
As depicted on the chart above, the yellow arrow depicts an uptrend on the chart, which is usually a higher high, higher low pattern on the chart. While on the other hand, the blue arrow depicts a downtrend on the chart, which is usually a lower high, lower low pattern formation on the chart.
Read more: How to read Crypto Candlestick Charts
Types Of Trendline
Along with that, trendlines are used to determine support and resistance levels too. Support levels are price regions that see a lot of buying action, bring in a lot of demand in the market and prevent prices from going below that price. On the other hand, resistance levels are regions that see a lot of selling action and these sellers bring about a lot of supply in the market and hence prevents prices from trading above this level.
How to Draw a Trendline
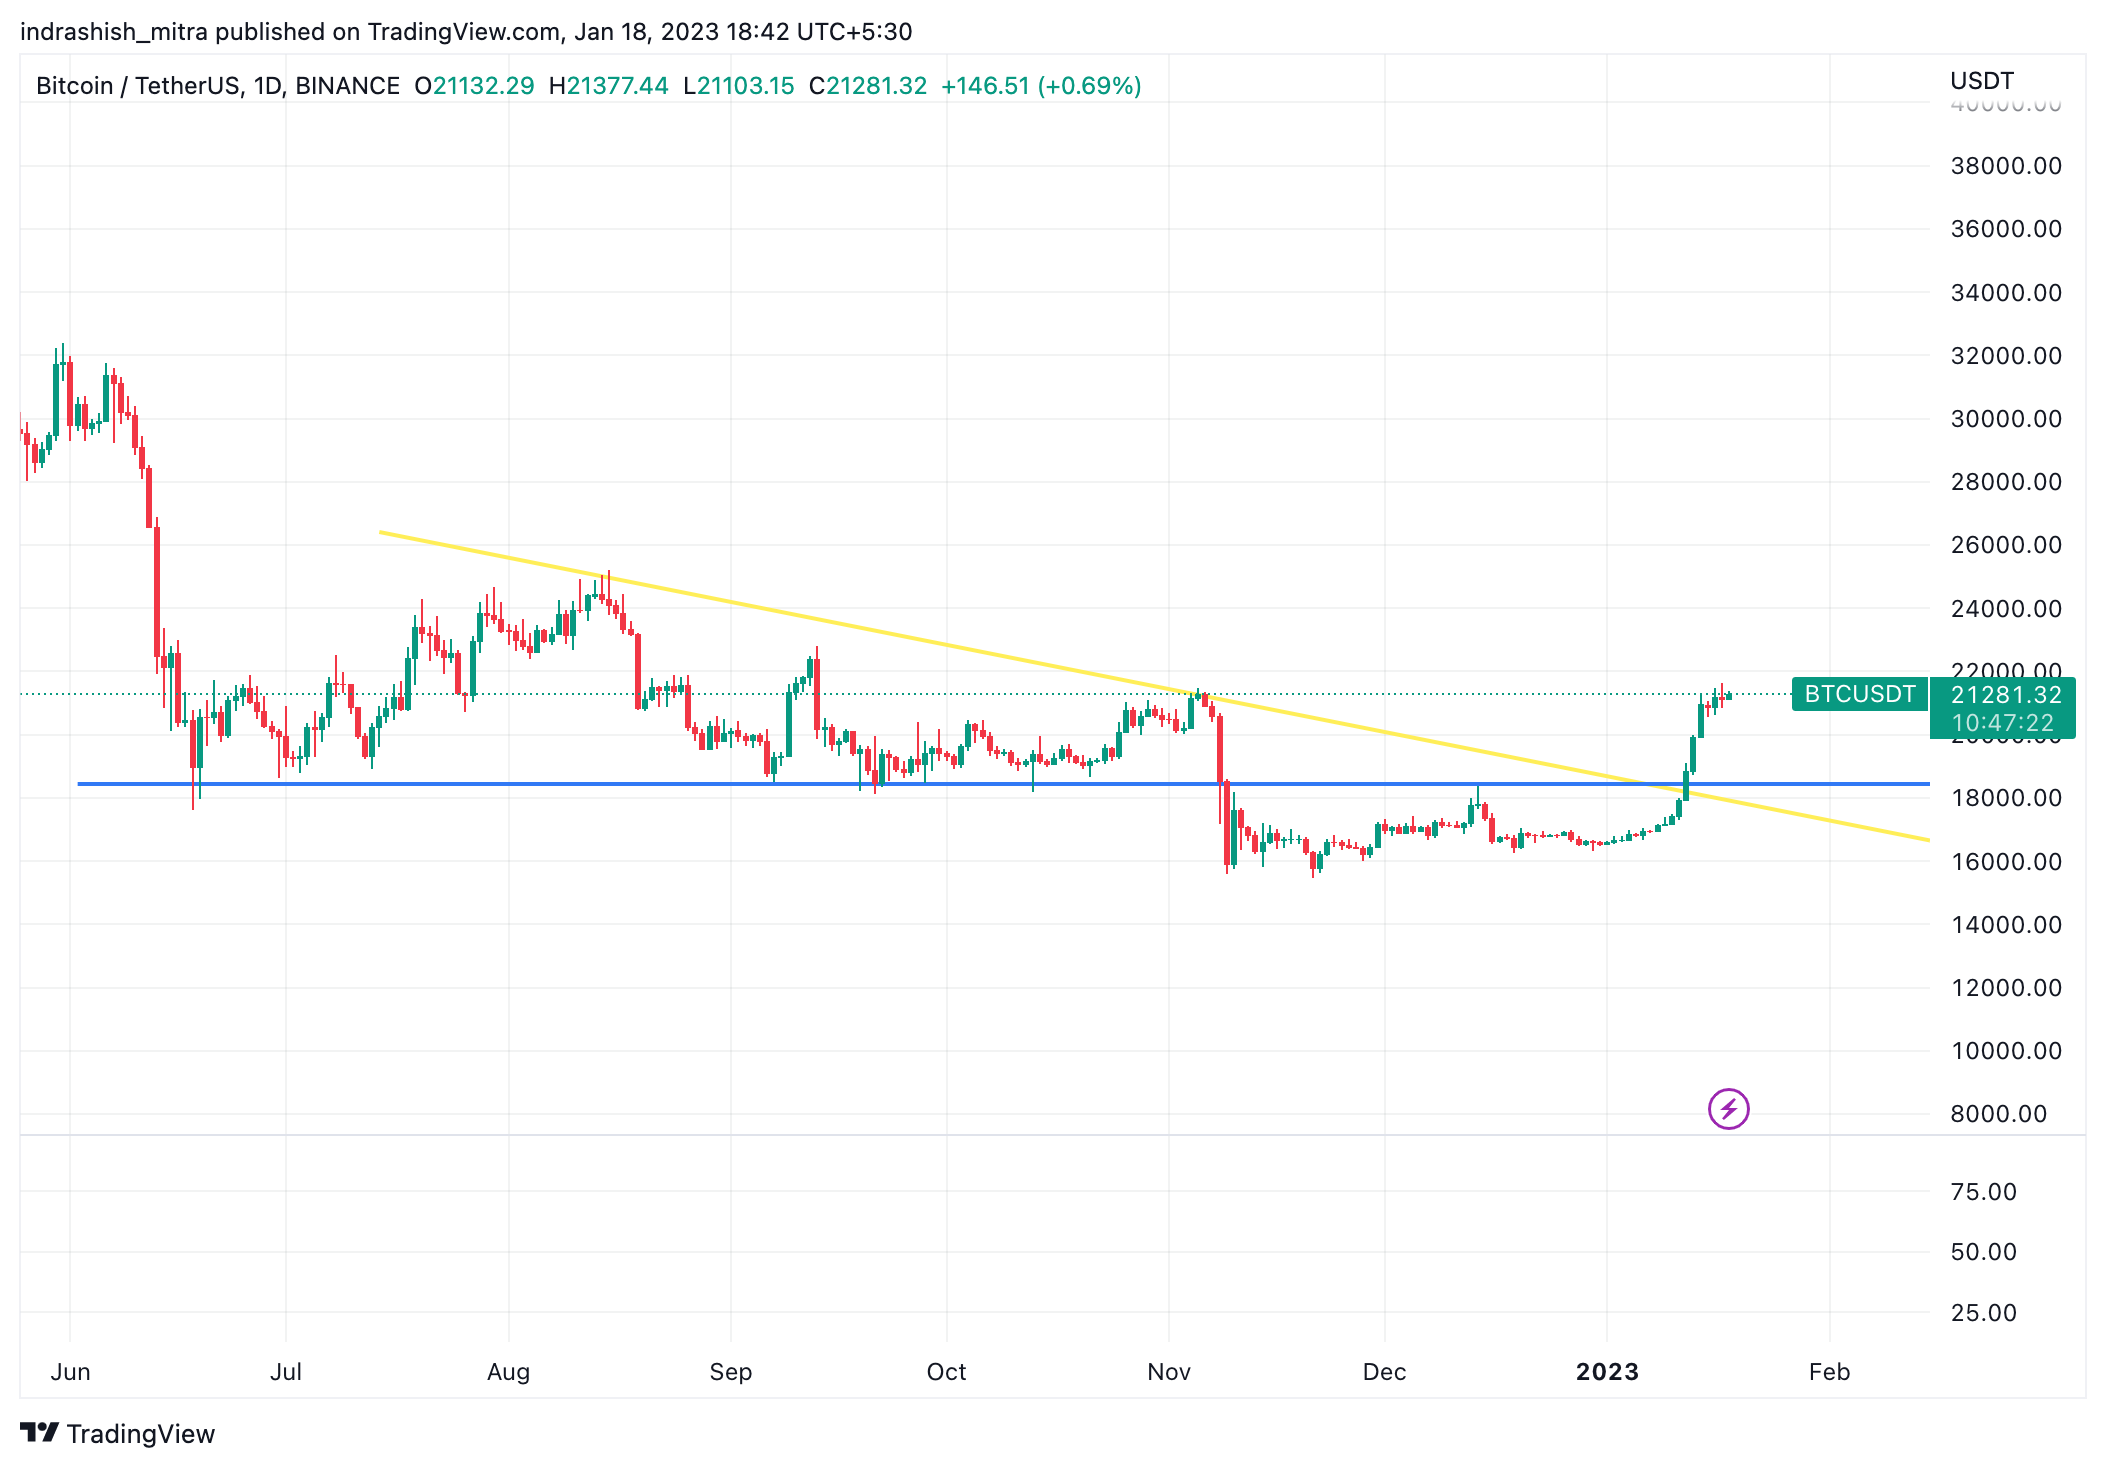
Drawing trendlines is a simple matter, really. In the chart above, you can observe two different trendlines with different colours.
The one in the yellow is a trendline that depicts the trend, in this case a downward trend. It has been drawn by connecting the upper extremities of price chart on a daily basis.
On the other hand, the trendline in blue is what is known as a support or resistance level. If prices are below this level, then it is considered to be a resistance level and once price of an asset is able to break past this and survive above it – it is known as the support level.
This analysis is a part of technical analysis which is a vast subject on basically behavioral analysis of the buying and selling patterns in an open market. Technical analysis method used for analysing and forecasting the direction of prices of various assets by studying of past market data, primarily price and volume. It helps to take advantage of trading opportunities in a market by analyzing statistical trends gathered from the abovementioned factors.
To know more about technical analysis, read: How to do Crypto Technical Analysis
Thus, while fundamental analysis of cryptos allow you to find good hidden gems to invest in, technical analysis give you the right price points to enter and exit the market to optimise your profitability.
Importance of Trendlines
Trendlines become very important in today’s world because this is a very tried and tested art of improving your odds while trading in the market. Using trendlines you can identify price trends in a certain asset and also target resistance and support levels in the market which you as a trader can use to increase the accuracy of the decision you make in the moment while taking a trade.
Things To Consider/Caution using trend line
While trendlines are a pretty accurate and a leading indicator of price in technical analysis – this analysis itself may fail in the real world when news comes into the play. So here are a few things that you need to consider.
1. News
As mentioned earlier, news is a factor in the market that is extremely important and practically trumps all other analysis that you can do – be it fundamental or technical. As a trader or investor in the crypto market, you will need to be very aware of all that is happening in the crypto and also the larger world around because in the globalized, interconnected world such as ours – it is impossible to anything to remain unaffected by something else. Hence news becomes important.
Say for example, in the world of crypto we see a very positive news coming into the market – all technical analysis made up to that point will go right out of the window. The market will move on the basis of overall market sentiment and technical analysis will fail to save you at that point.
Stay updated with Top Crypto News on CoinDCX Blog!
2. Trading volumes
This is another factor you as a trader will need to be very aware of. Market trends typically follow trading volumes very closely. As and when market prices reach an ascending or descending trendline – they look for volumes to support the move. And if volumes are there in a particular trend, then it could even indicate that the current trend might be a weak one and there might be little to no follow up on that particular trend.
3. Time Frame
The crypto market tend to be fractal in nature. This means the price patterns you identify on longer-term timeframes can be found within shorter-term timeframes too. However, the signals generated on the shorter-term time frames tend to be less reliable, because there’s not as much data going into the creation of each price bar. Therefore, depending on your strategy, you will need to adjust and account for the differences in these and take trades in the crypto market.
Summary
Thus to summarize, trendlines are one of the most basic and simplest tools available to a crypto trader to identify trading opportunities in the market. These techniques can be easily picked up and used by traders to make better trades in the market and increase profitability and the odds of a winning trade. Thus it becomes imperative for all traders, it is important to learn how to read crypto charts – with trend lines, you can get a good grasp on price movements.
FAQ
Related posts

Understanding the Different Types of Cryptos: Coins, Tokens, Altcoins & More Explained
Explore the major types of crypto assets and their unique roles.

PAWS Telegram Game: The New Tap to Earn Game That Is Beating Hamster Kombat
Discover how to play and earn with PAWS Telegram game.