
Key Takeaways:
- Bitcoin price witnessed a sudden 10% intraday surge in October, reaching $30,000 before a slight correction. It’s trading close to its highest point in October, near $28,000.
- Ethereum price slipped below $1,600 but sits at $1,560. A minor bullish catalyst could help regain strength. Support lies between $1,500 and $1,550.
- Loom Network price went on a strong bullish rally, surging by 547% from September 19, currently trading at $0.297. Expectations remain bullish with occasional minor corrections.
- Solana’s price, after stability around $20, rallied from $14 to nearly $30, currently trading at approximately $24. It formed a symmetrical triangle pattern, with key levels at $27 resistance and $18.5 support.
- Shiba Inu price entered a bearish phase in mid-August, with a 13.5% decline, facing challenges with its moving averages and support levels.
- The wider crypto market maintains a range, with a total market capitalization of around $1.05 trillion as of writing. It’s slightly bearish due to fundamental concerns and a death cross in major EMAs. A stable rebound is needed for a bullish sentiment.
Bitcoin Price Sees Sudden 10% Intraday Surge!
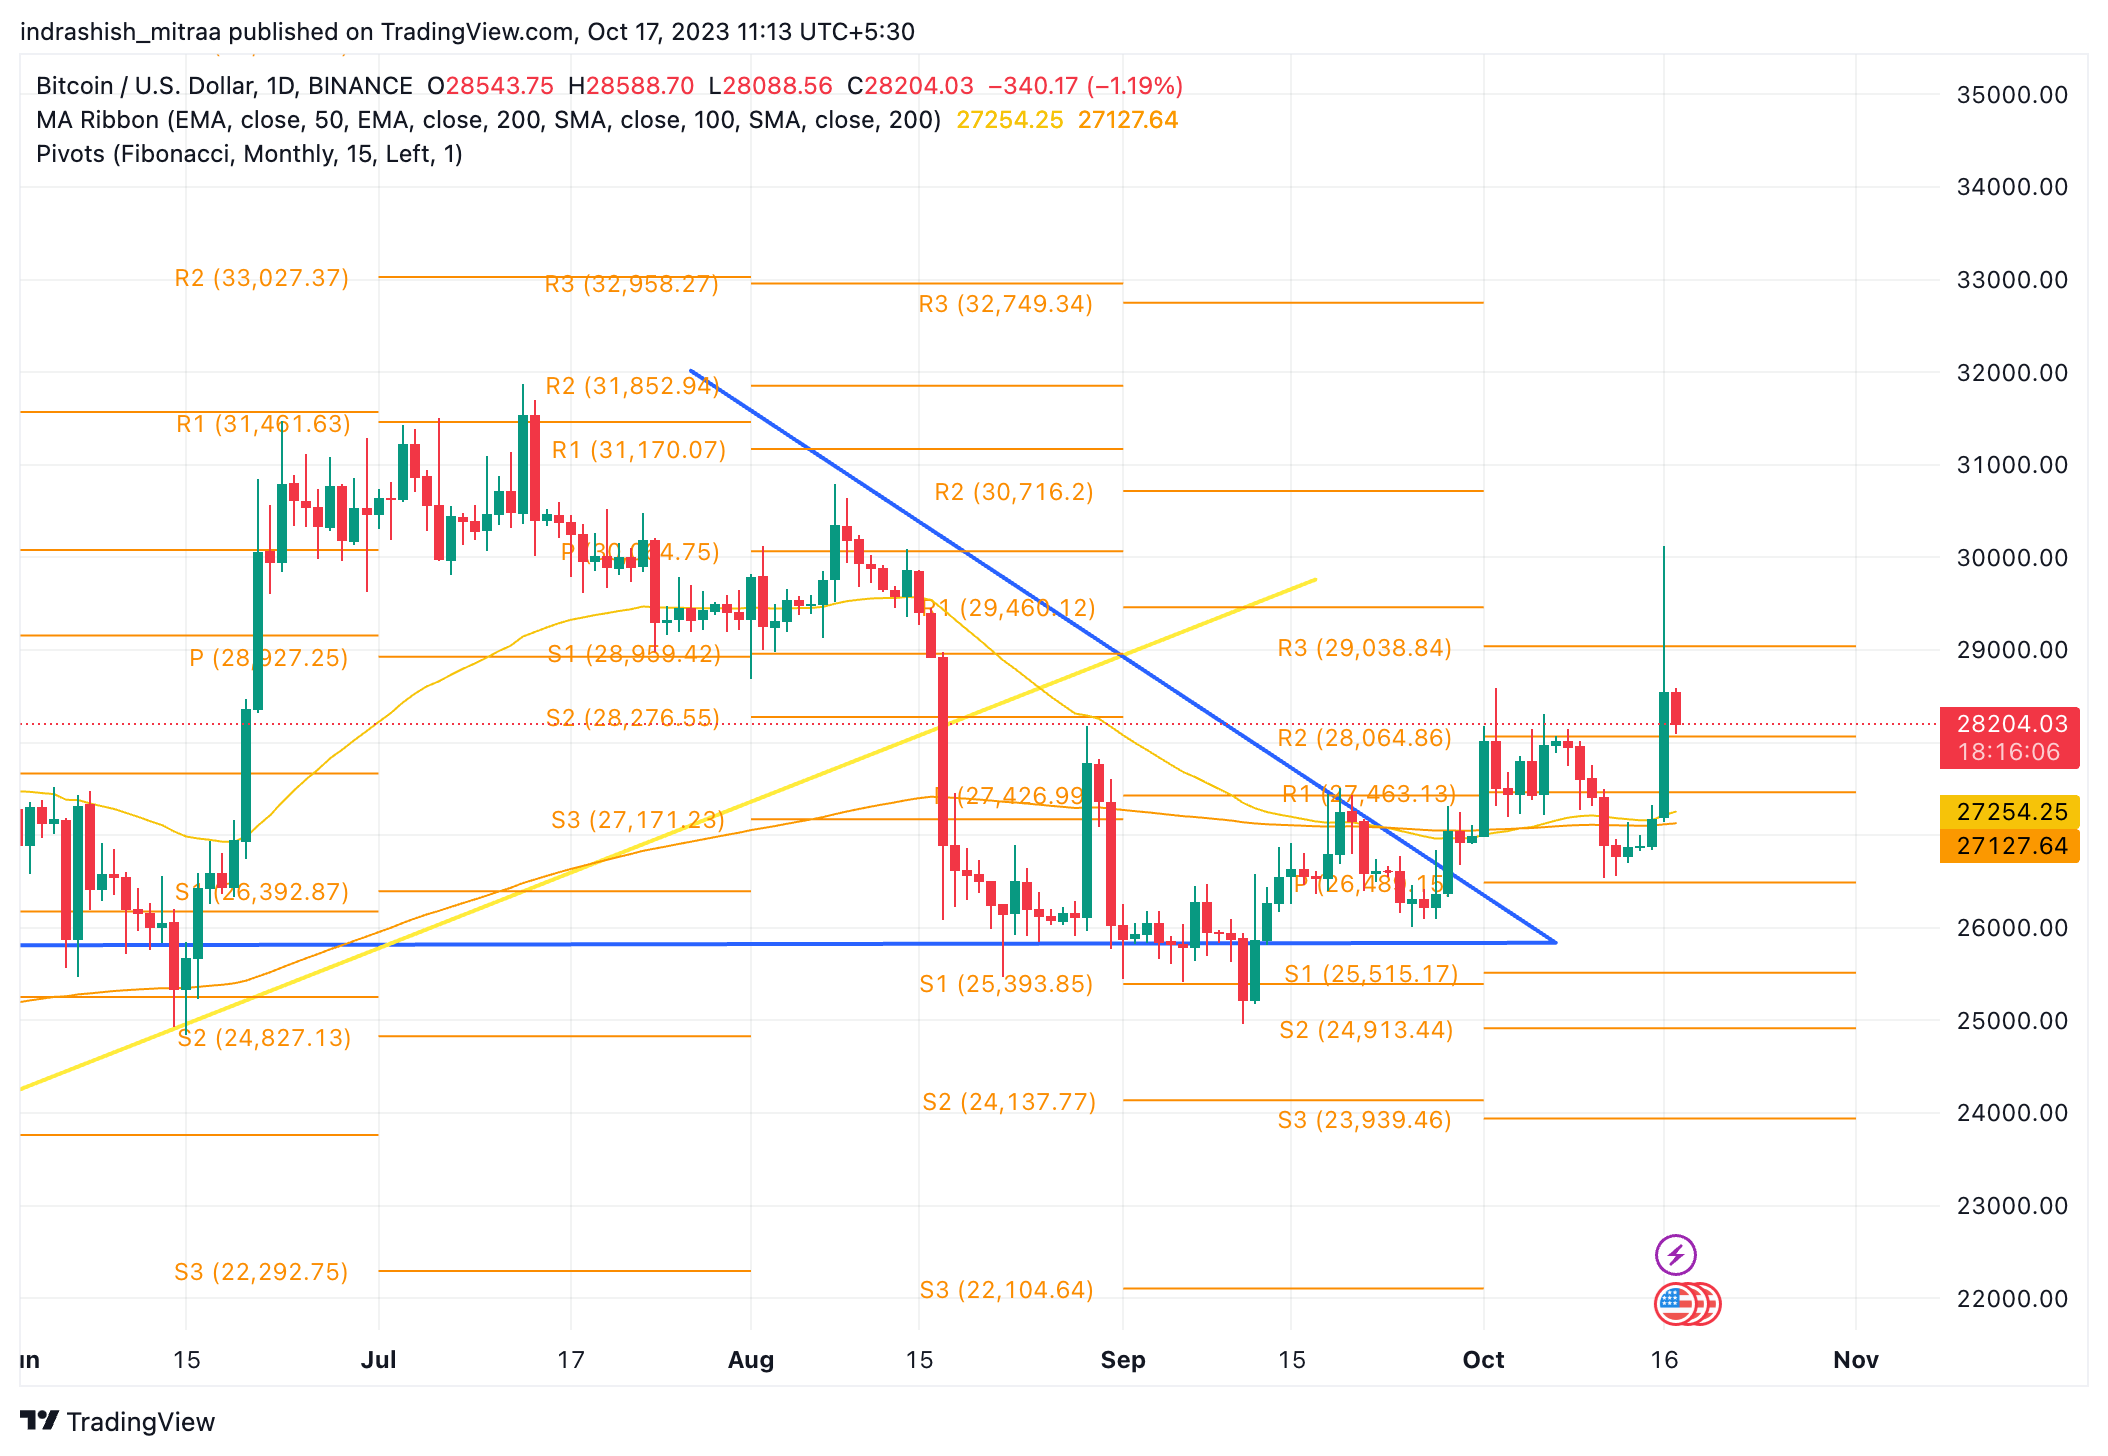
BTC/USD | Source: TradingView
- Bitcoin price in October traded in a rangebound manner up until October 16, 2023 – when BTC price surged a massive 10% in a matter of a couple of hours, going from just over $27,000 all the way to touch $30,000 before correcting slightly and currently trading just above $28,000.
- BTC price is trading very close to the highest point of October and also one of the highest points since early August 2023.
- On the flip side, the price at the Fibonacci S1 support level of $25,500 and the base of the descending triangle at $25,800 appear to be consolidating as a robust foundation for Bitcoin price in the future. This level endured two tests, first in June and more recently in September, underscoring its resilience.
- On a somewhat bullish note, Bitcoin’s 50-day and 200-day Exponential Moving Averages (EMA) experienced a crossover after a brief increase in BTC price, potentially stimulating buying activity in the market and offering support despite recent corrections.
- The next resistance for BTC price to breach and sustain above is $29,000, which also coincides with the Fibonacci pivot R3 level on the chart.
- Conversely, the range between $25,400 and $25,800 could potentially evolve into a dependable support zone in the near future, serving as a protective buffer for Bitcoin price.
Read More: Bitcoin Price Prediction
Ethereum Price Under Heavy Bearishness
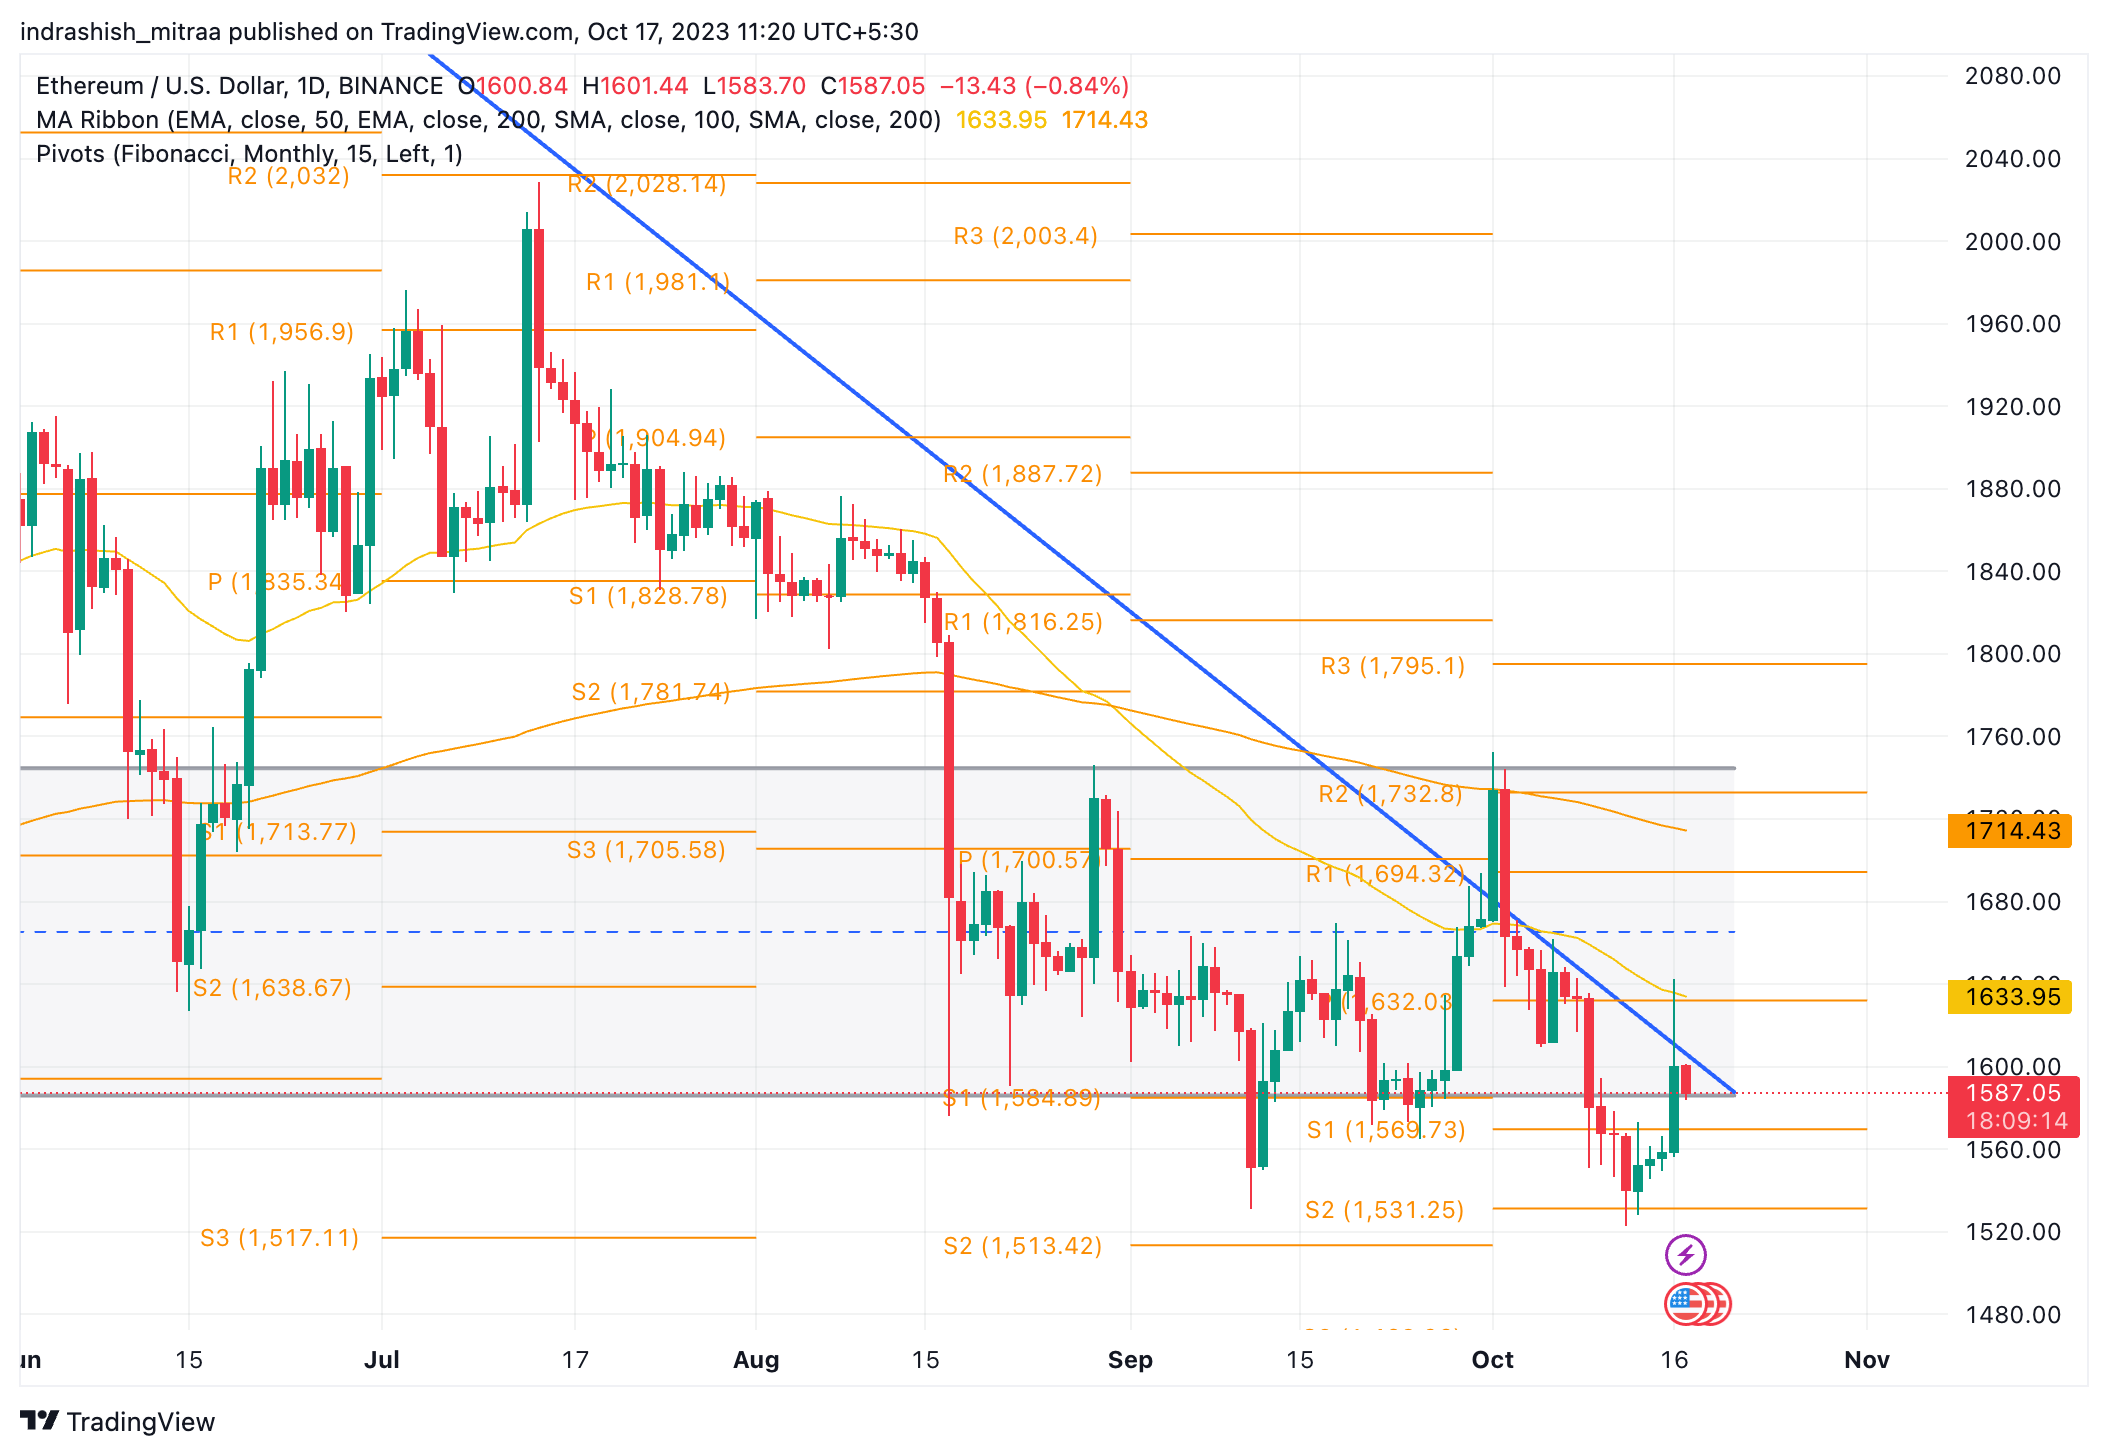
ETH/USD | Source: TradingView
- Ethereum price recently slipped significantly below the $1,600 threshold, a level it had successfully maintained for several weeks – and despite a slight surge over the past day – the $1600 mark couldn’t be breached.
- Ethereum price currently sits just under $1,600, at $1,560. A minor bullish catalyst could potentially assist in its return to a more secure position.
- On the downside, Ethereum price has its next support level in the range of $1,500 to $1,550. This range holds substantial psychological significance and closely corresponds with the S2 level of the Fibonacci pivot structure.
- However, Ethereum price faces the challenge of countering the bearish influence of the 50-day and 200-day exponential moving averages to regain strong bullish momentum. These averages crossed in a bearish manner in early September 2023, potentially increasing selling pressure in the market.
- To reestablish a bullish sentiment, ETH price must effectively surpass both the $1,600 mark and the $1,700 threshold in succession.
- Although the early months of 2023 brought positive developments in the prices of both Bitcoin and Ethereum, Ethereum notably lagged behind. While Bitcoin maintained its strength, Ethereum experienced a significant retracement, with its price dropping by approximately 27% from its year-to-date peak of $2,100, reached in April 2023. Nevertheless, Ethereum has still managed to secure about a 30% gain in the year 2023 so far.
Learn More: Ethereum Price Prediction
Loom Network On Strong Bullish Rally!
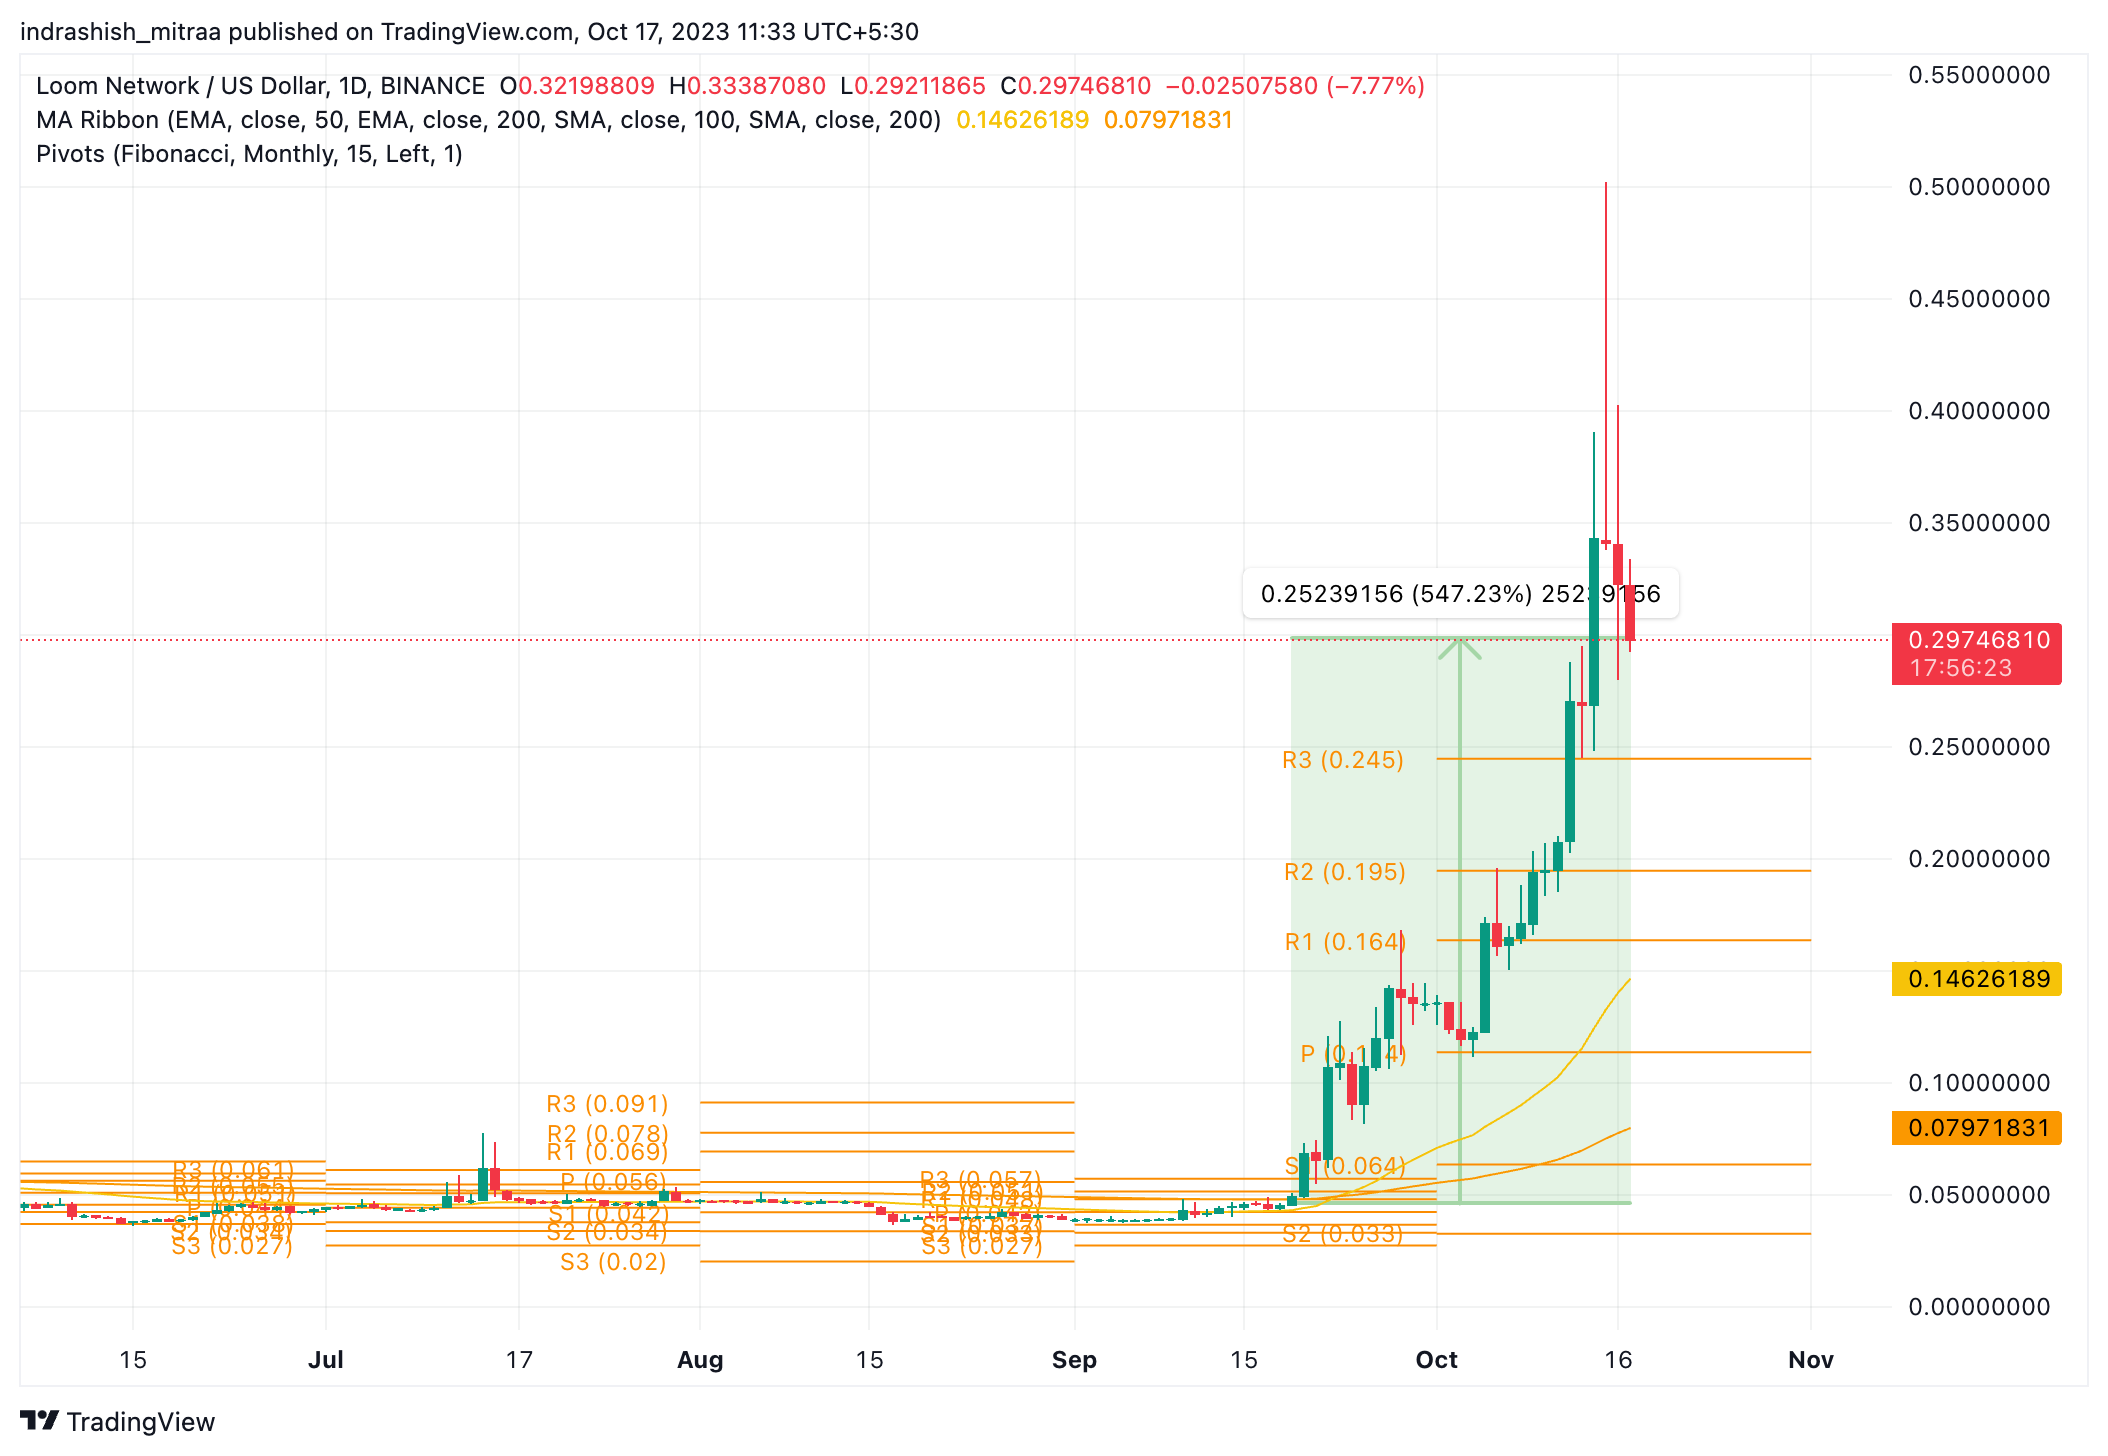
LOOM/USD | Source: TradingView
- Loom Network, an altcoin, exhibited a relatively subdued price performance throughout 2023. However, in recent weeks, it has embarked on an astounding rally, surging by an impressive 547% starting from September 19. At the time of writing, it’s trading around $0.297.
- According to CoinMarketCap data, LOOM price has seen a robust 53% in the last seven days. This substantial growth has contributed to a year-to-date increase of approximately 596%.
- This surge triggered an intriguing bullish event called a “golden crossover,” signifying the 50-day moving average crossing above the 200-day moving average. Additionally, prices broke through these moving averages in September, offering strong support for the ongoing rally.
- In early October, LOOM price experienced a minor correction, finding support at the Fibonacci pivot level. Since then, it has surpassed all resistance levels marked by the Fibonacci pivot points, a common occurrence during significant crypto rallies.
- Currently, LOOM price hovers comfortably above the Fibonacci pivot R3 level of $0.245. It has surpassed its previous all-time high of $0.245, entering uncharted territory, suggesting a bullish outlook moving forward.
- In summary, the overall outlook for the token appears notably bullish, with expectations of the rally continuing, occasionally interrupted by minor corrections.
Solana Price Sustains Near $24!
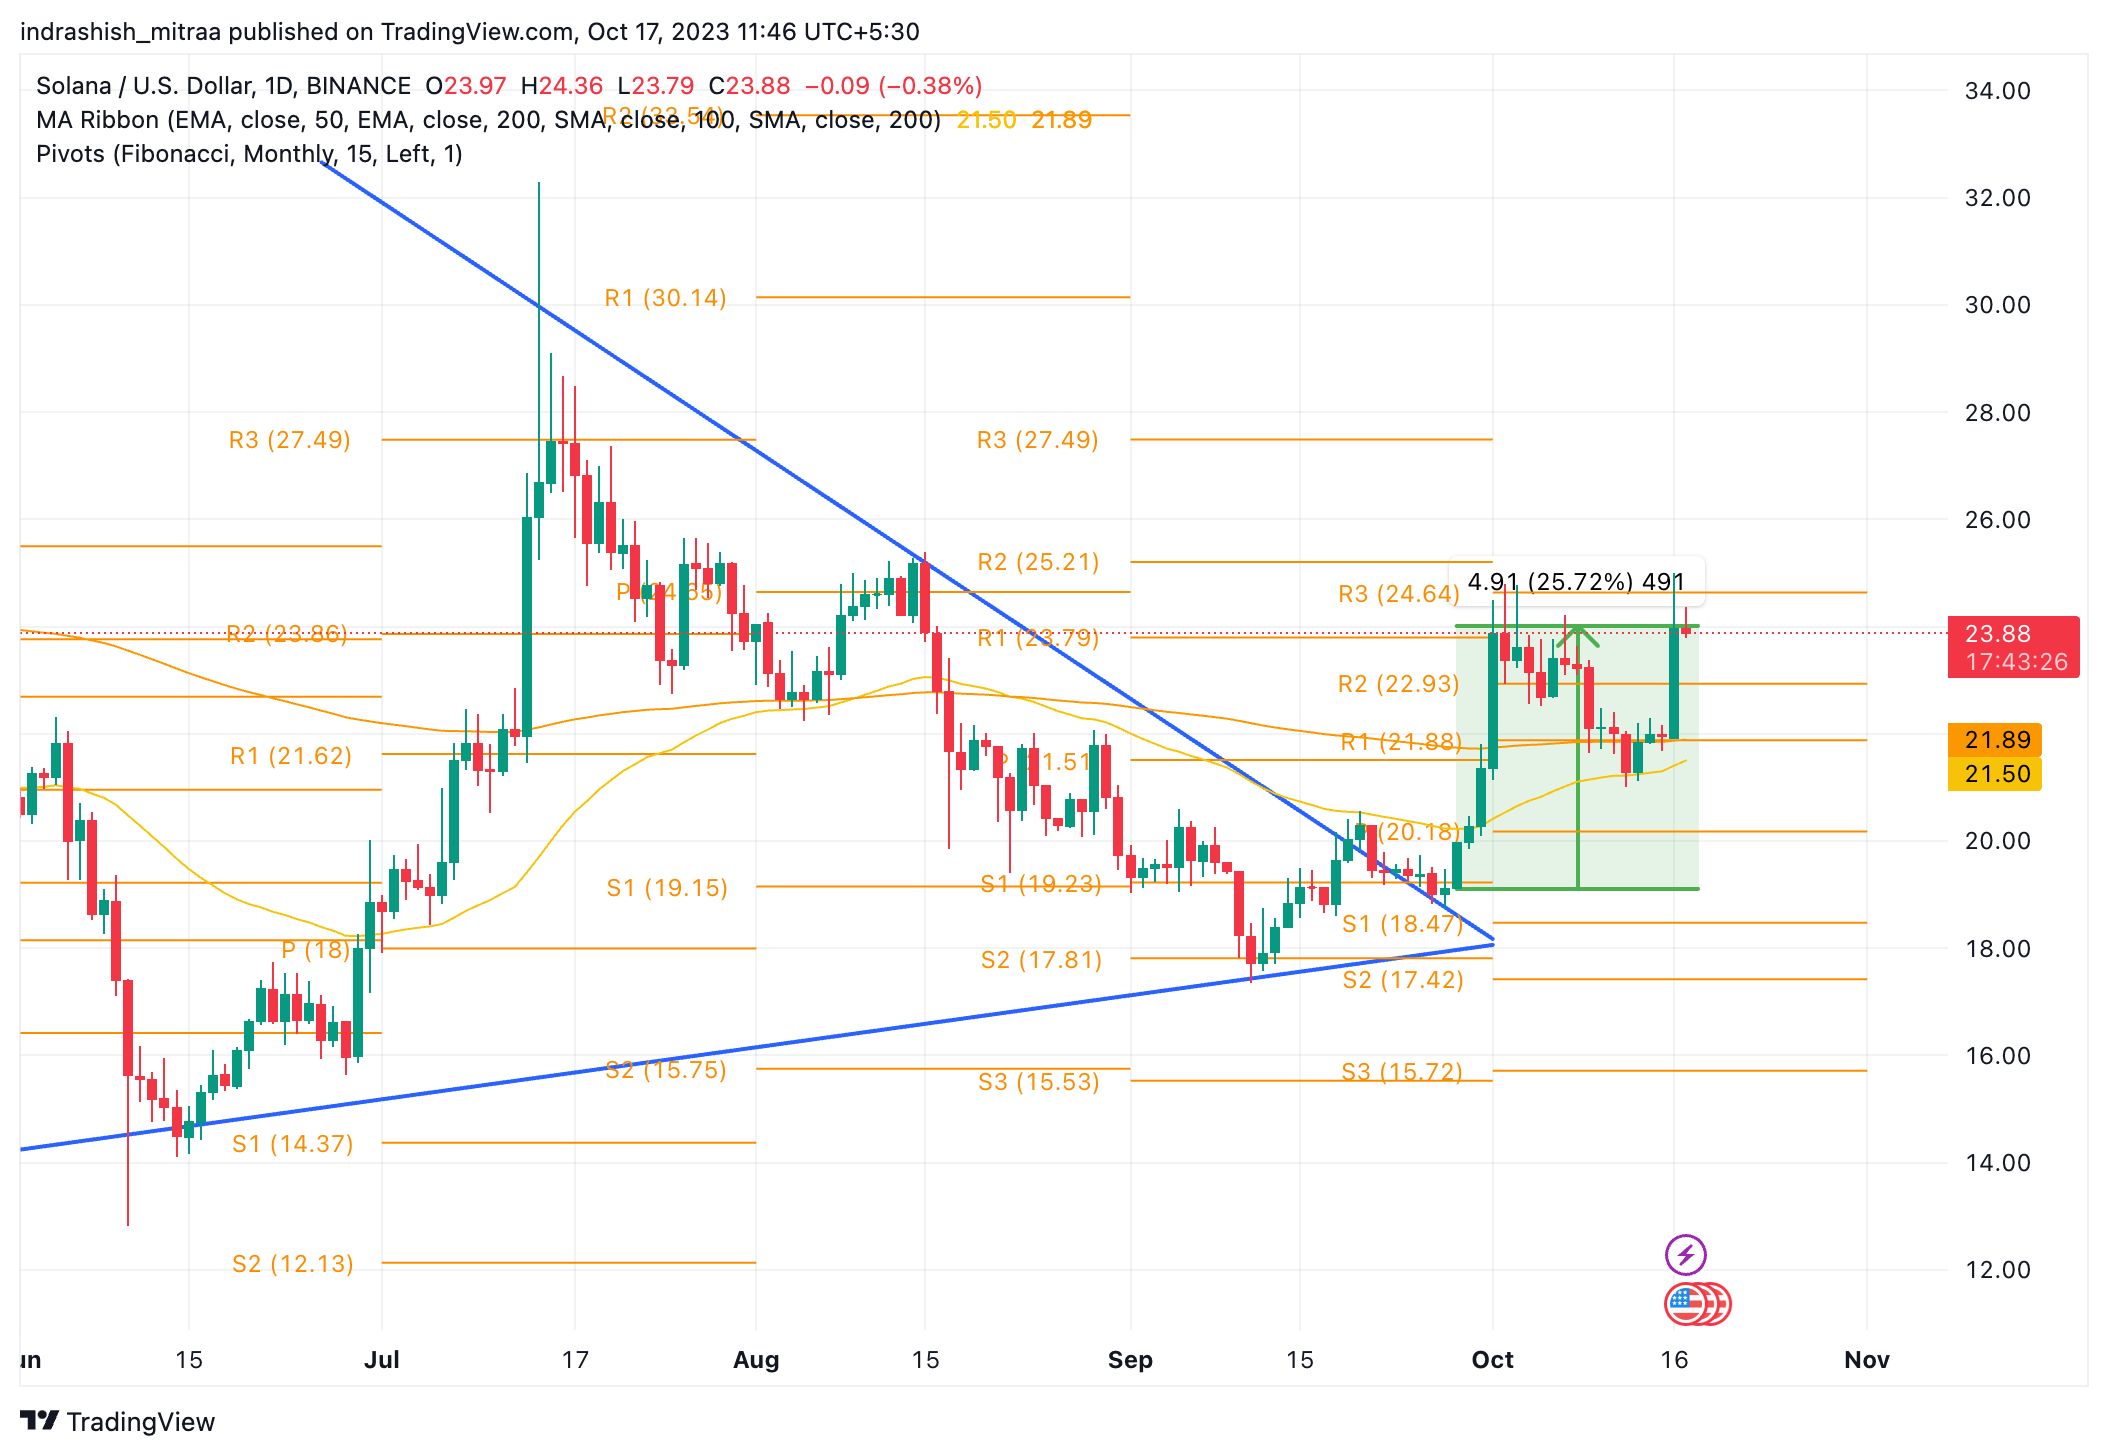
SOL/USD | Source: TradingView
- When examining SOL price from a technical standpoint, it embarked on a significant upward trajectory earlier in the year, ascending from below $10 and nearly reaching the $26 mark.
- Between February and May 2023, SOL price demonstrated remarkable stability, consistently holding above the critical $20 support level on the price charts. However, the situation took a turn in June 2023 when a substantial market downturn caused a drop to $14.
- Following this decline, Solana’s price made a remarkable recovery compared to other cryptos in the top 10 by market capitalization. It rebounded from the $14 level, briefly surging to $30 and then stabilizing around $18 for a period in September before initiating another rally commencing on September 28, 2023.
- Since September 28, 2023, Solana’s price has experienced a substantial 25% rally and is currently finding support near the R2 level of the Fibonacci pivot points. If this support holds, another rally may follow shortly.
- From a broader perspective, Solana’s price formed a symmetrical triangle pattern on the charts. Just a few days into this pattern, the altcoin successfully underwent a convincing breakout, currently trading at approximately $24 at the time of writing this article.
- Key price levels to monitor include $27 as a resistance area on the upside and $18.5 as a support zone on the downside.
- Conversely, SOL’s 50-day and 200-day exponential moving averages show indications of a potential bullish golden crossover. This significant development, combined with a golden crossover, is expected by experts to trigger a fresh surge of buying activity in SOL’s price action.
Additional Read: Solana Price Prediction
Shiba Inu
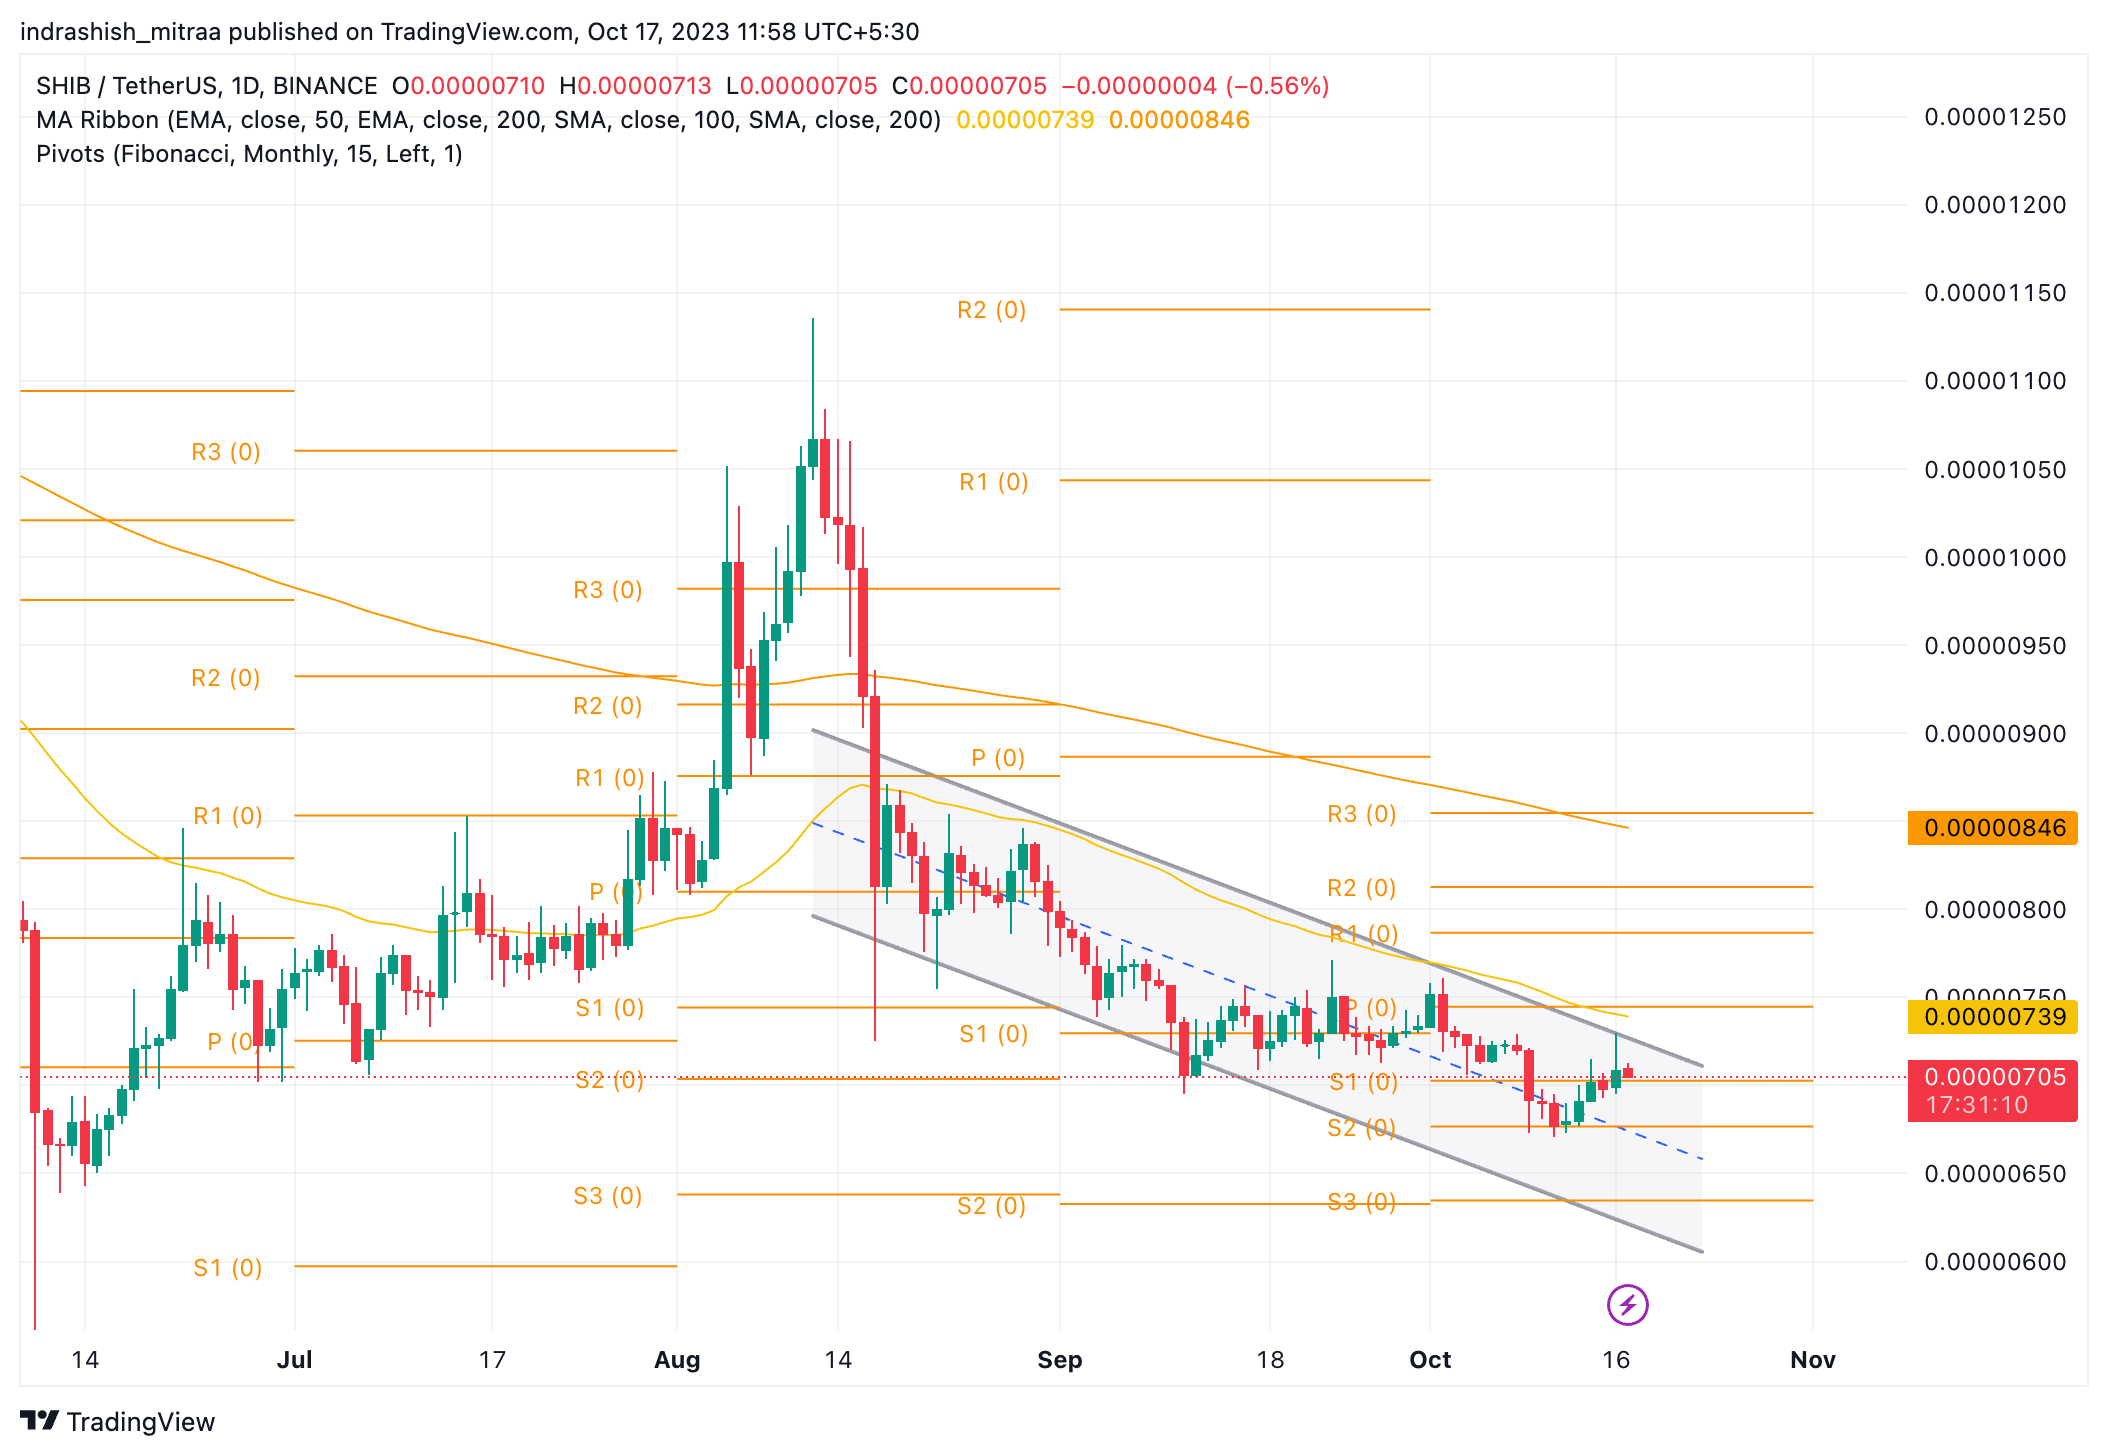
SHIB/USD | Source: TradingView
- Shiba Inu exhibited strength between June and July 2023 but transitioned into a bearish phase in mid-August, as evident from the descending parallel channel in grey.
- Within the past two months, SHIB price experienced a significant decline of over 13.5%, breaching both the 50-day and 200-day exponential moving averages.
- Furthermore, SHIB’s 50-day and 200-day exponential moving averages encountered a death cross earlier in May 2023, and since then, the gap between them has been expanding at a substantial pace. This widening gap presents a considerable challenge for the bulls in their efforts to stage a recovery.
- From a technical analysis perspective, the primary obstacle for SHIB price recovery lies in surpassing the critical level of $0.0000085, as indicated by the Fibonacci pivot points displayed on the chart.
- However, the current outlook leans bearish, given that Shiba Inu price is trading below the pivot level at $0.0000074 (P). If the bearish momentum persists, the next viable target could be approximately $0.0000067 (S2).
Read On: Shiba Inu Price Prediction
Overall Crypto Market Wrap-Up
In general, the wider crypto market has been relatively range-bound, maintaining a total market capitalization of approximately $1.05 trillion. Over the past two month, it has fluctuated between the $1 trillion and $1.08 trillion thresholds. Presently, there’s a slight bearish bias due to perceived fundamental weaknesses. The overall trend has shifted towards bearish territory, marked by all major Exponential Moving Averages (EMA) experiencing a death cross, alongside weakened support levels.
Therefore, in order to witness a recovery, the market must establish a comprehensive and stable rebound, paving the way for substantial and sustainable bullish sentiment in the foreseeable future.
Related posts

Bitcoin Price Hits New All-Time High Following Fed’s 25-Basis-Point Rate Cut
Fed’s interest rate cut spurs crypto momentum, boosting Bitcoin and Ethereum prices.

Blum Secures Major Investment from TOP to Strengthen DeFi Presence in TON Ecosystem
TOP’s backing aims to accelerate Blum’s multi-blockchain expansion.