
Key Takeaways:
- Sui’s Rocky Start: Sui, a relatively new entrant to the crypto market, has faced a challenging initiation in the midst of a bear market. Since its launch in early May 2023, its price has steadily declined.
- Bearish Trends: Sui’s price is down by about 15% in the last 30 days and has experienced a substantial drop of over 45% in the past 90 days.
- Technical Analysis: Currently priced at $0.37, Sui is trading below its 50-day exponential moving average. A potential rally hinges on breaking and maintaining levels above this moving average.
- Reversal Pattern: Encouragingly, a descending wedge pattern on the chart suggests a possible bullish breakout in the future. Immediate resistance levels stand at $0.5, aligning with the 50-day EMA and the descending wedge.
- Code Commitment: On a positive note, Sui’s network exhibits a strong uptrend in cumulative code commits, signifying robust development efforts and dedication from the project’s team.
Sui Price Technical Overview
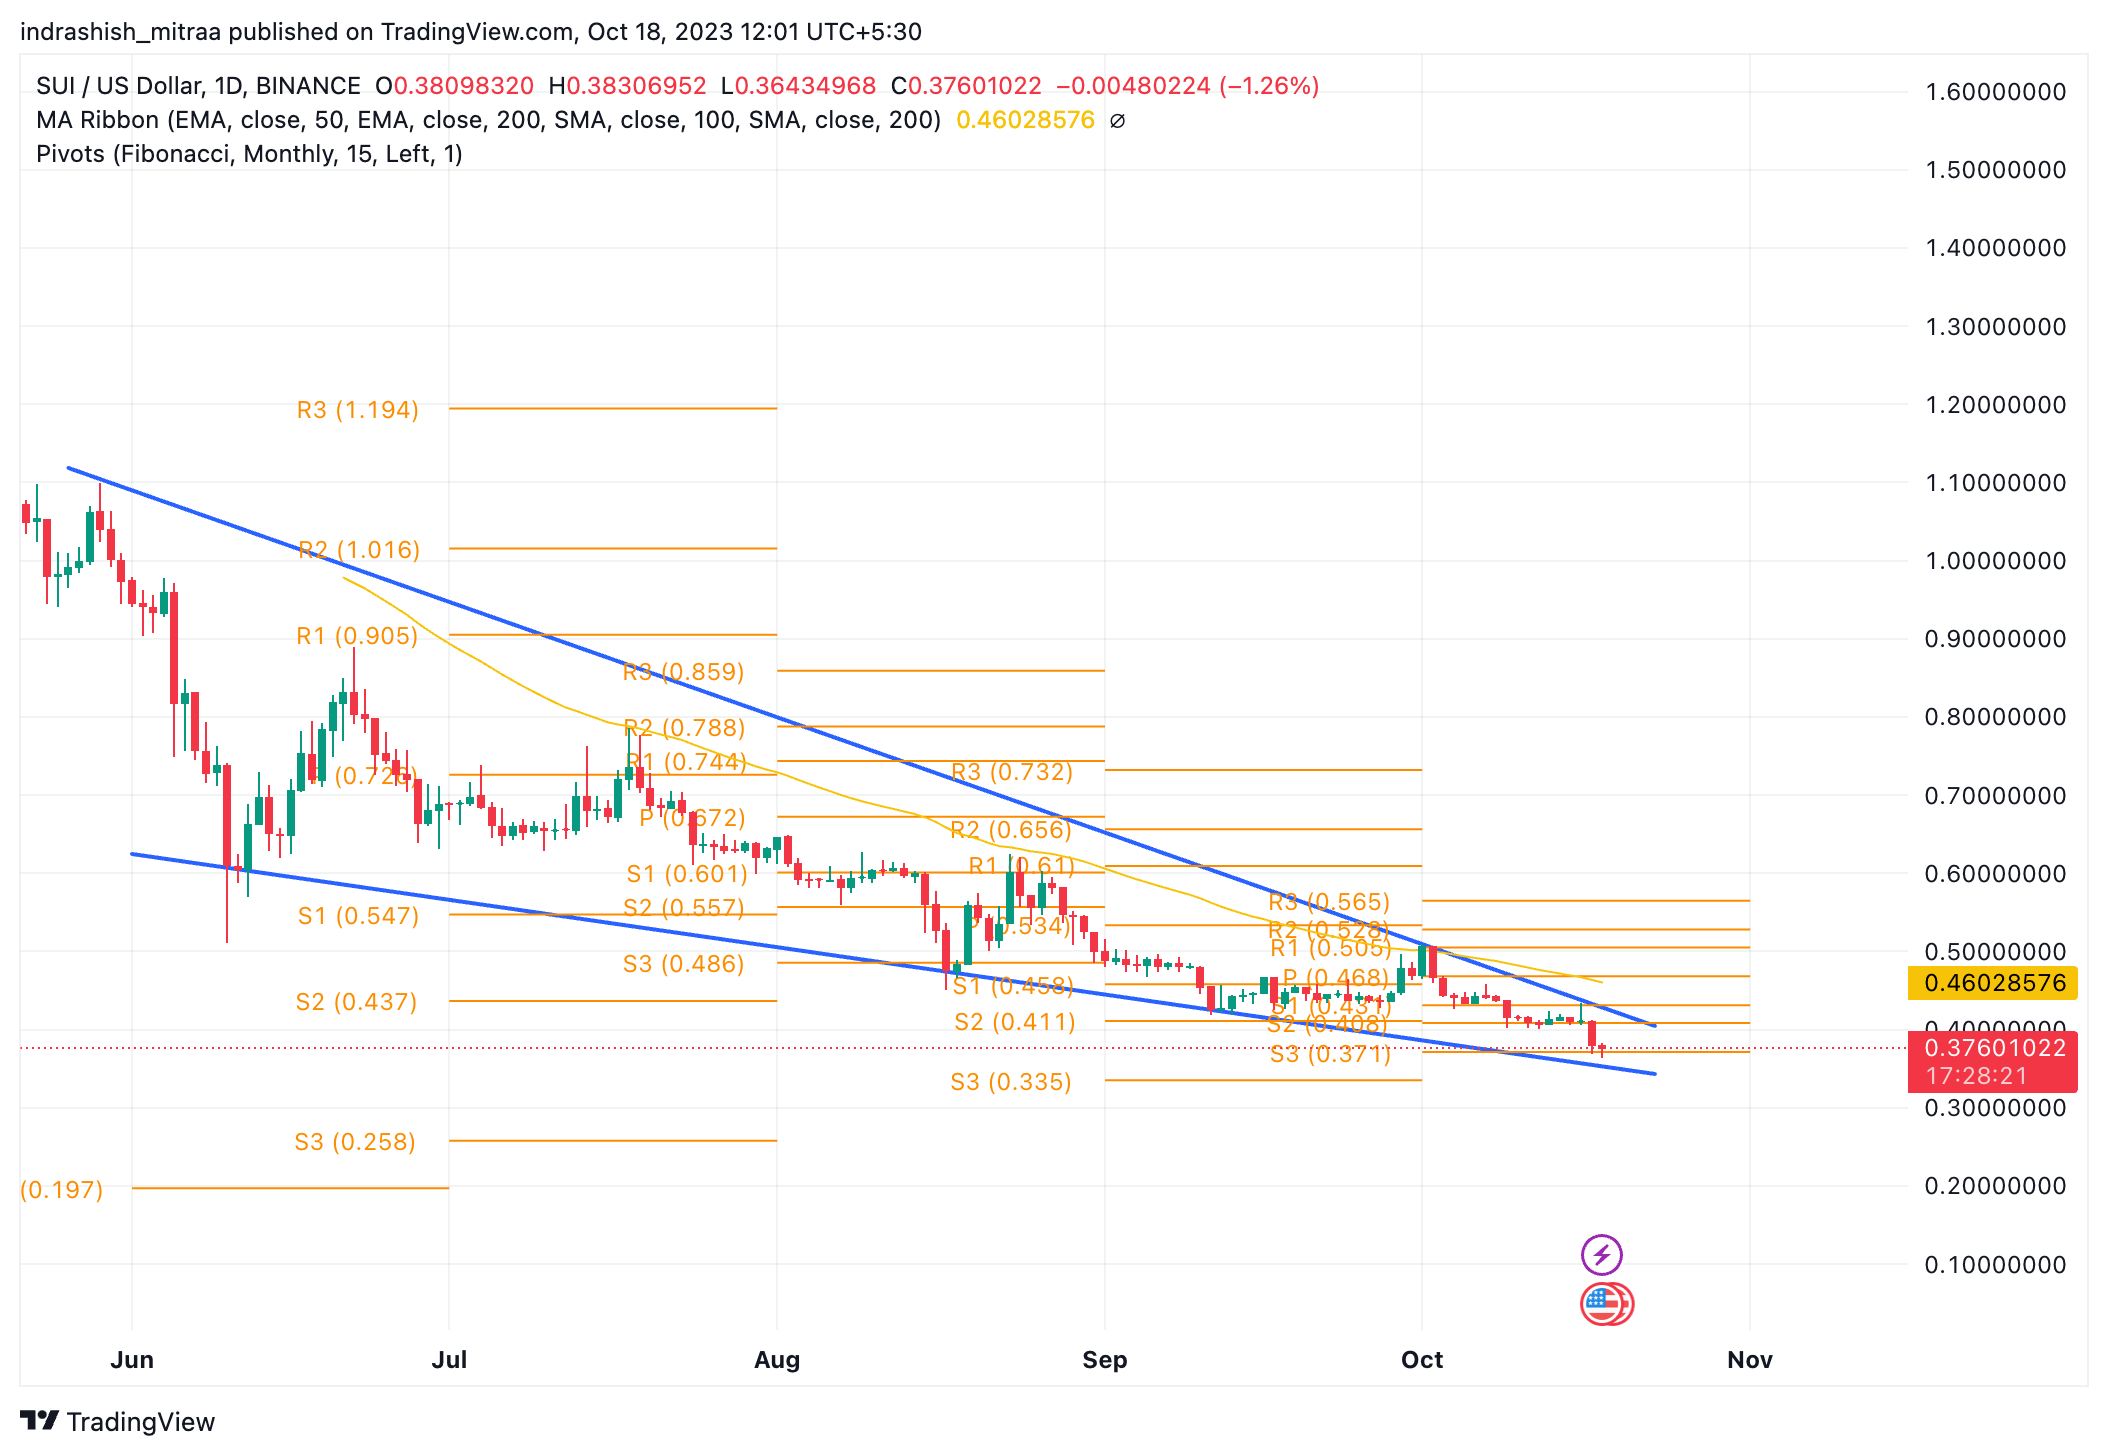
SUI/USD | Source: Tradingview
- One of the more recent entrants into the crypto market, Sui is a crypto project that hasn’t been doing very well in its first bear market. Launched as recently as May 3, 2023 – this is an altcoin that has been seeing a steady decline ever since it began trading in the open market.
- According to data from CoinMarketCap, Sui price is down nearly 15% in the past 30 days and down over 45% in the past 90 days!
- SUI price, at $0.37, is trading well below its 50-day exponential moving average on the chart – as indicated by the yellow line currently placed at $0.46. If SUI price wants to see a rally in the near future, it will need to break out of the 50-day exponential moving average and sustain above it.
- On an optimistic note, SUI price is currently undergoing a descending wedge pattern on the chart, as demarcated by the two blue trendlines. A wedge pattern is widely considered to be a reversal pattern, and thus a descending wedge typically indicates a bullish breakout sometime in the future.
- On an immediate basis, Sui price will need to breach $0.5, which coincides with the 50-day EMA and also breakout above the descending wedge convincingly to stage a proper bullish recovery.
- On the downside, Sui price is currently taking support of the S3 level of the Fibonacci pivot point and a breakdown below this will bring Sui price into uncharted bearish territory.
Sui On-chain Overview
Cumulative Code Commits
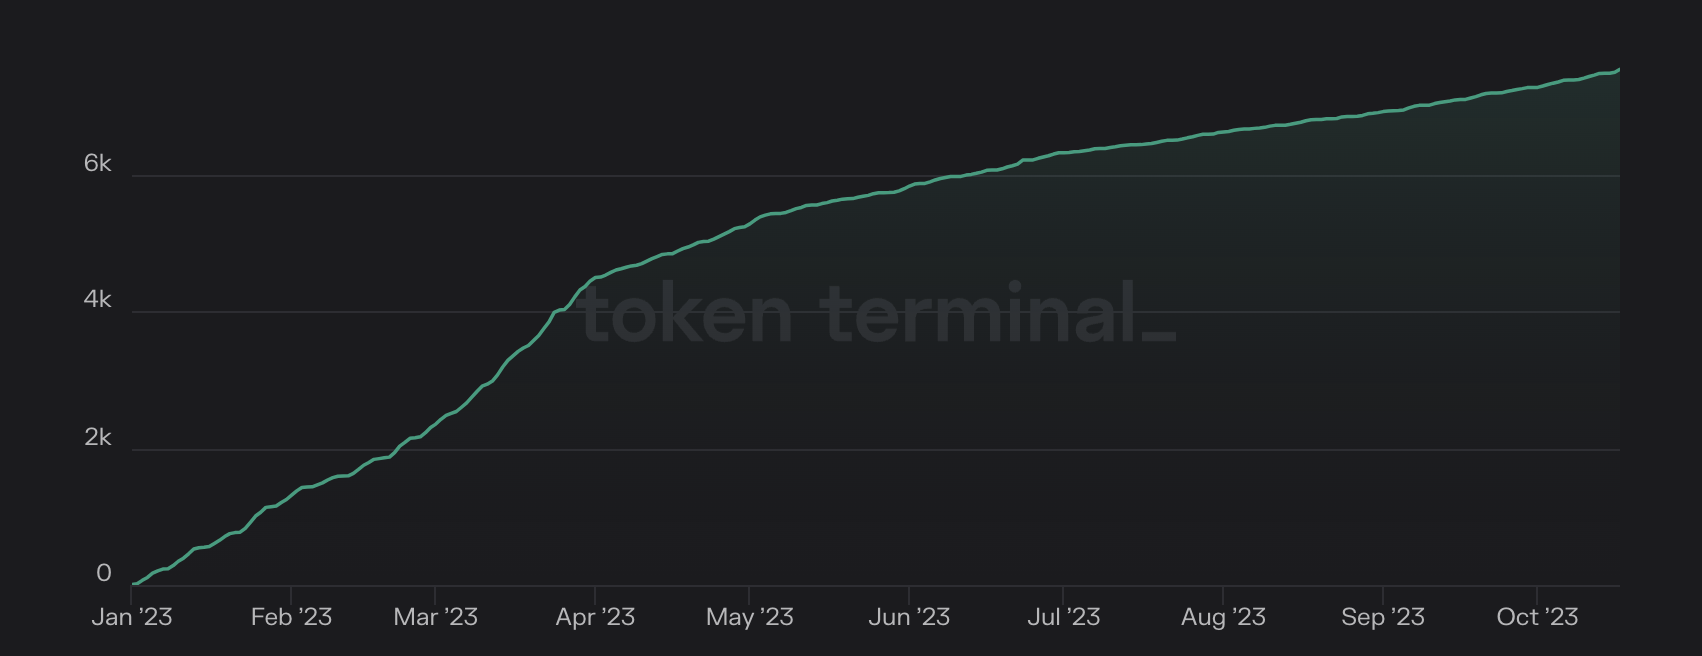
Daily Cumulative Code Commits | Source: Token Terminal
The “Cumulative Code Commits” on the Sui network have shown a robust uptrend, indicating increased development activity and commitment from the network’s development team. This metric, which tracks the number of code commits over time, is a valuable measure of a blockchain project’s progress and the level of effort being invested in its development.
Monitoring the cumulative code commits, along with other on-chain metrics, provides valuable insights into the health and progress of the Sui network, ultimately contributing to a better understanding of its long-term potential.
Read More: SUI Price Prediction
Conclusion
Sui’s initial journey in the crypto market has been marked by challenges, yet its recent technical patterns hint at the potential for a bullish reversal. Sui’s price trends, while currently bearish, could turn around with a successful breakout above the 50-day EMA and the descending wedge. Furthermore, the project’s commitment to development, reflected in the increasing code commits, provides hope for its long-term prospects. Monitoring both technical indicators and on-chain metrics is essential to gauge Sui’s future performance in the volatile crypto landscape.
Related posts

Bitcoin Price Hits New All-Time High Following Fed’s 25-Basis-Point Rate Cut
Fed’s interest rate cut spurs crypto momentum, boosting Bitcoin and Ethereum prices.

Blum Secures Major Investment from TOP to Strengthen DeFi Presence in TON Ecosystem
TOP’s backing aims to accelerate Blum’s multi-blockchain expansion.