KEY TAKEAWAYS:
- MATIC price technical indications look moderately optimistic as of writing this article.
- MATIC’s development activity sees a 470% jump over the course of 2022!
- MATIC’s daily active addresses trend remains sombre amid the bear market.
- The network growth for MATIC token has been sporadic and news based.
- MATIC’s supply on exchanges have fallen by over 44% – a positive indication.
- On the negative side – MATIC’s social dominance numbers have crashed 85% in 2022.
MATIC 2022 TECHNICAL OVERVIEW
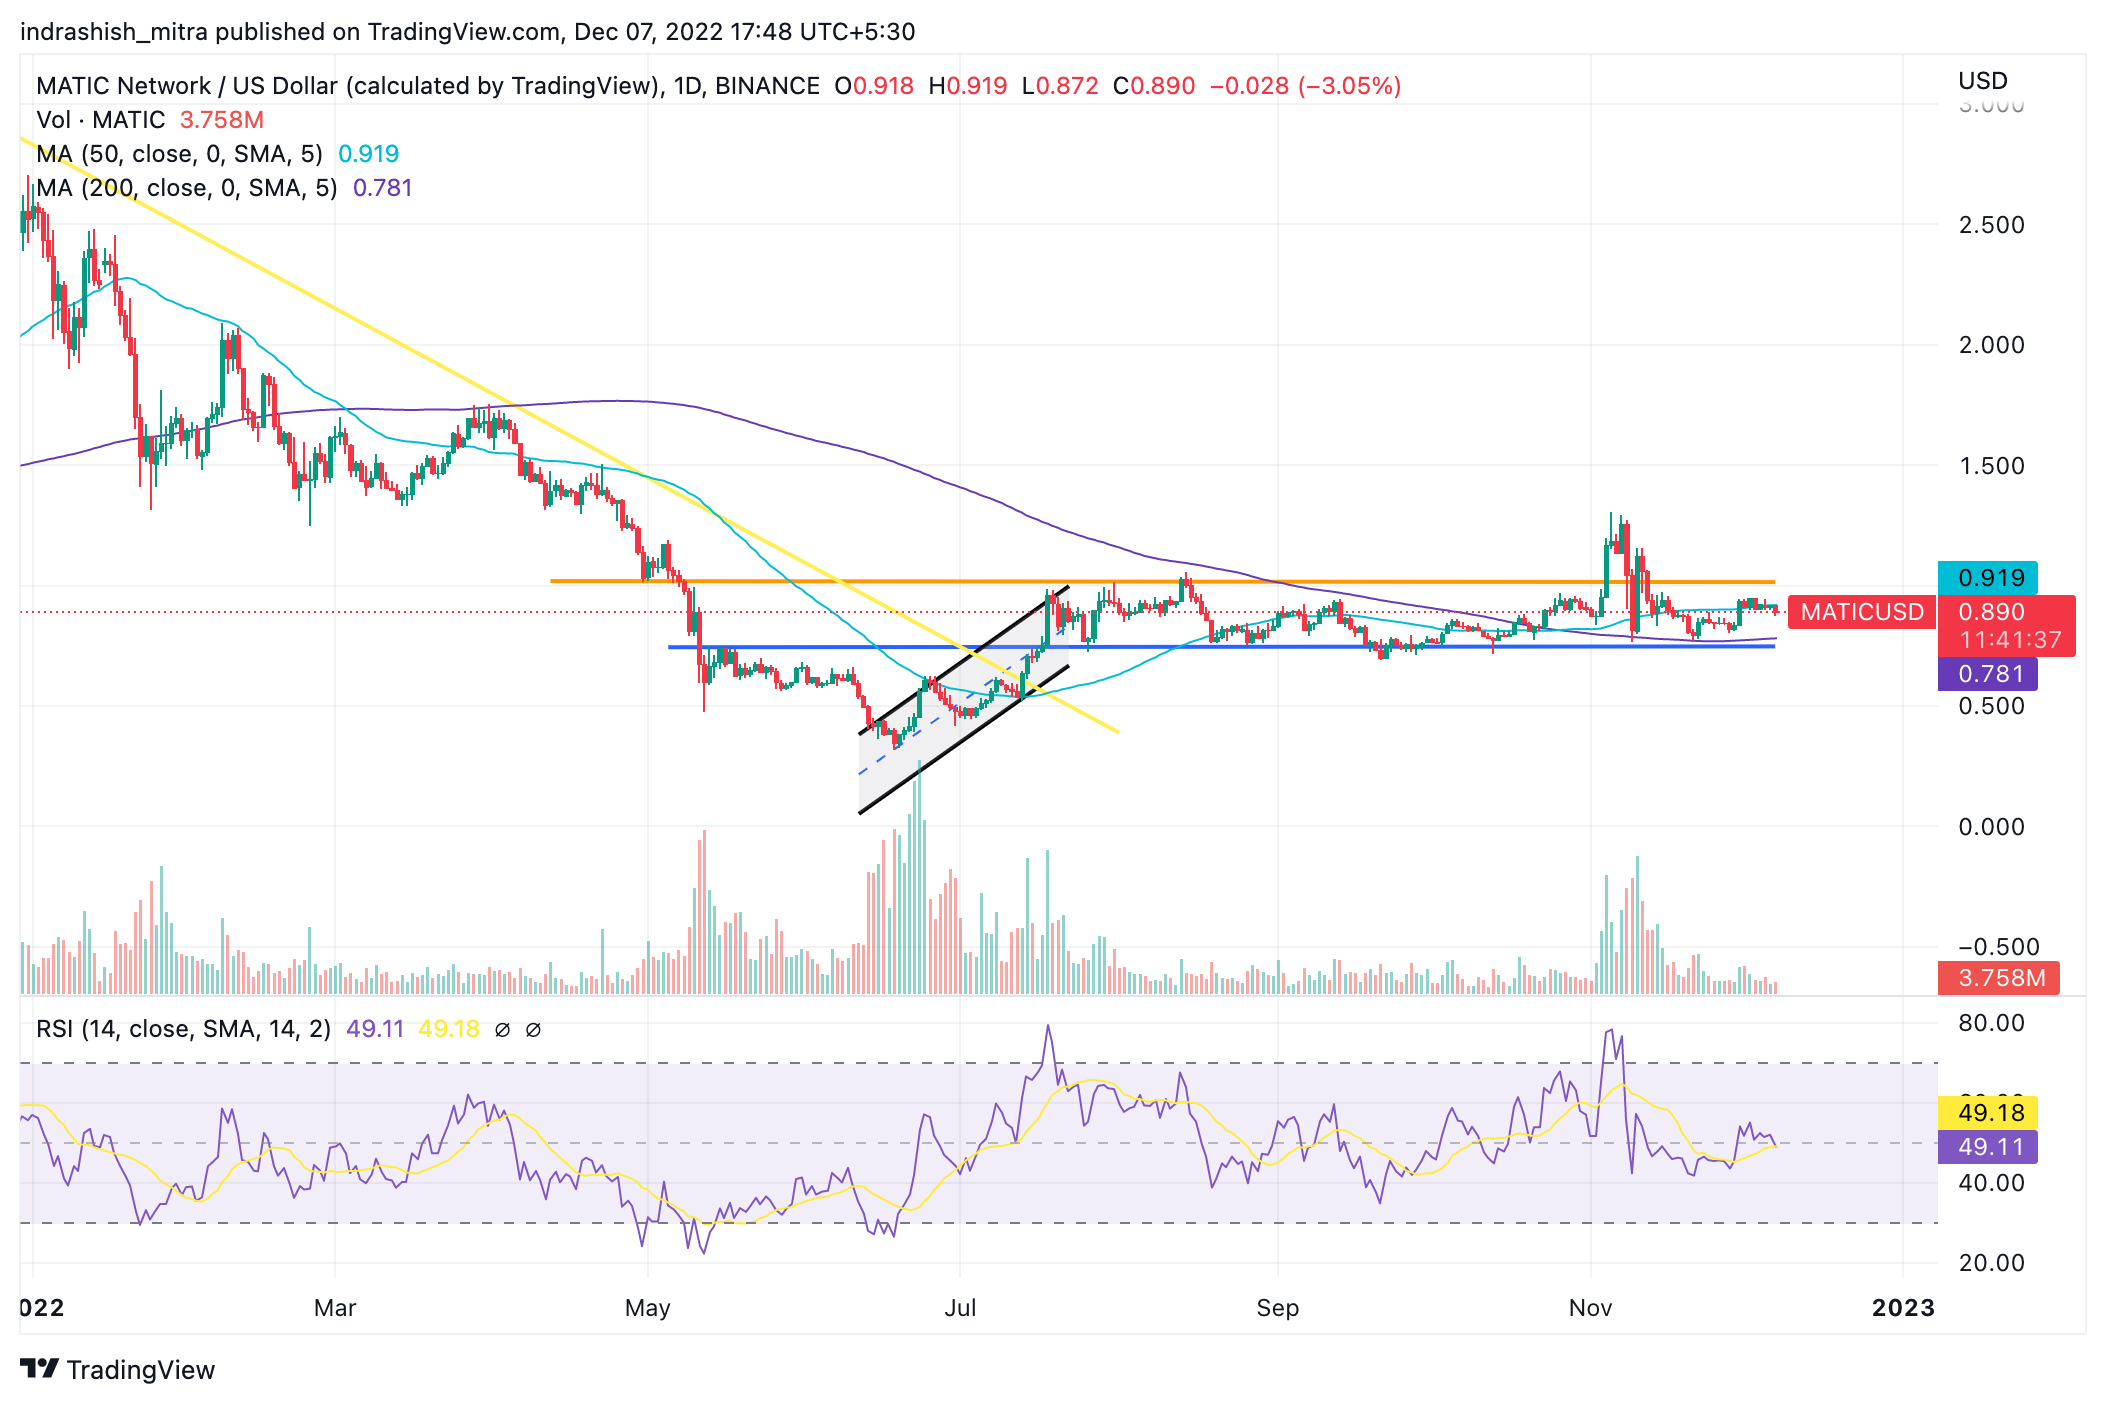
MATIC/USD | Source: Tradingview
MATIC price performance has been reasonably in line with the overall crypto market capitalization – both of which have fallen between 60-70% since the beginning of 2022. However, if we were to take a broader look at the overall year for MATIC – it was on a losing streak primarily in the beginning of the year when MATIC price fell from around $2.5 down all the to sub $0.5 levels within the first six months alone.
But since June, right after it touched its YTD lows of $0.3, MATIC quickly recovered on the back of recovering sentiment in the overall market backed mainly by the anticipation ahead of the Ethereum Merge that went into effect on 15 September. So since the end of July, MATIC price managed to recover and since then has been trading in a range bound manner. This is a wholly optimistic sign as in this same timeframe, in November after the catastrophic FTX collapse – the overall crypto market led by none other than Bitcoin itself touched new YTD lows, but MATIC managed to sustain its levels. Hence, looking forward at 2023, if the market sentiment and prices improve, then Polygon’s MATIC could very well be one of the top performers amongst the top 10 cryptos by market capitalization.
Read more: MATIC Price Prediction
MATIC: On-chain overview for the past year
MATIC’S Development activity trend – UP 470%!
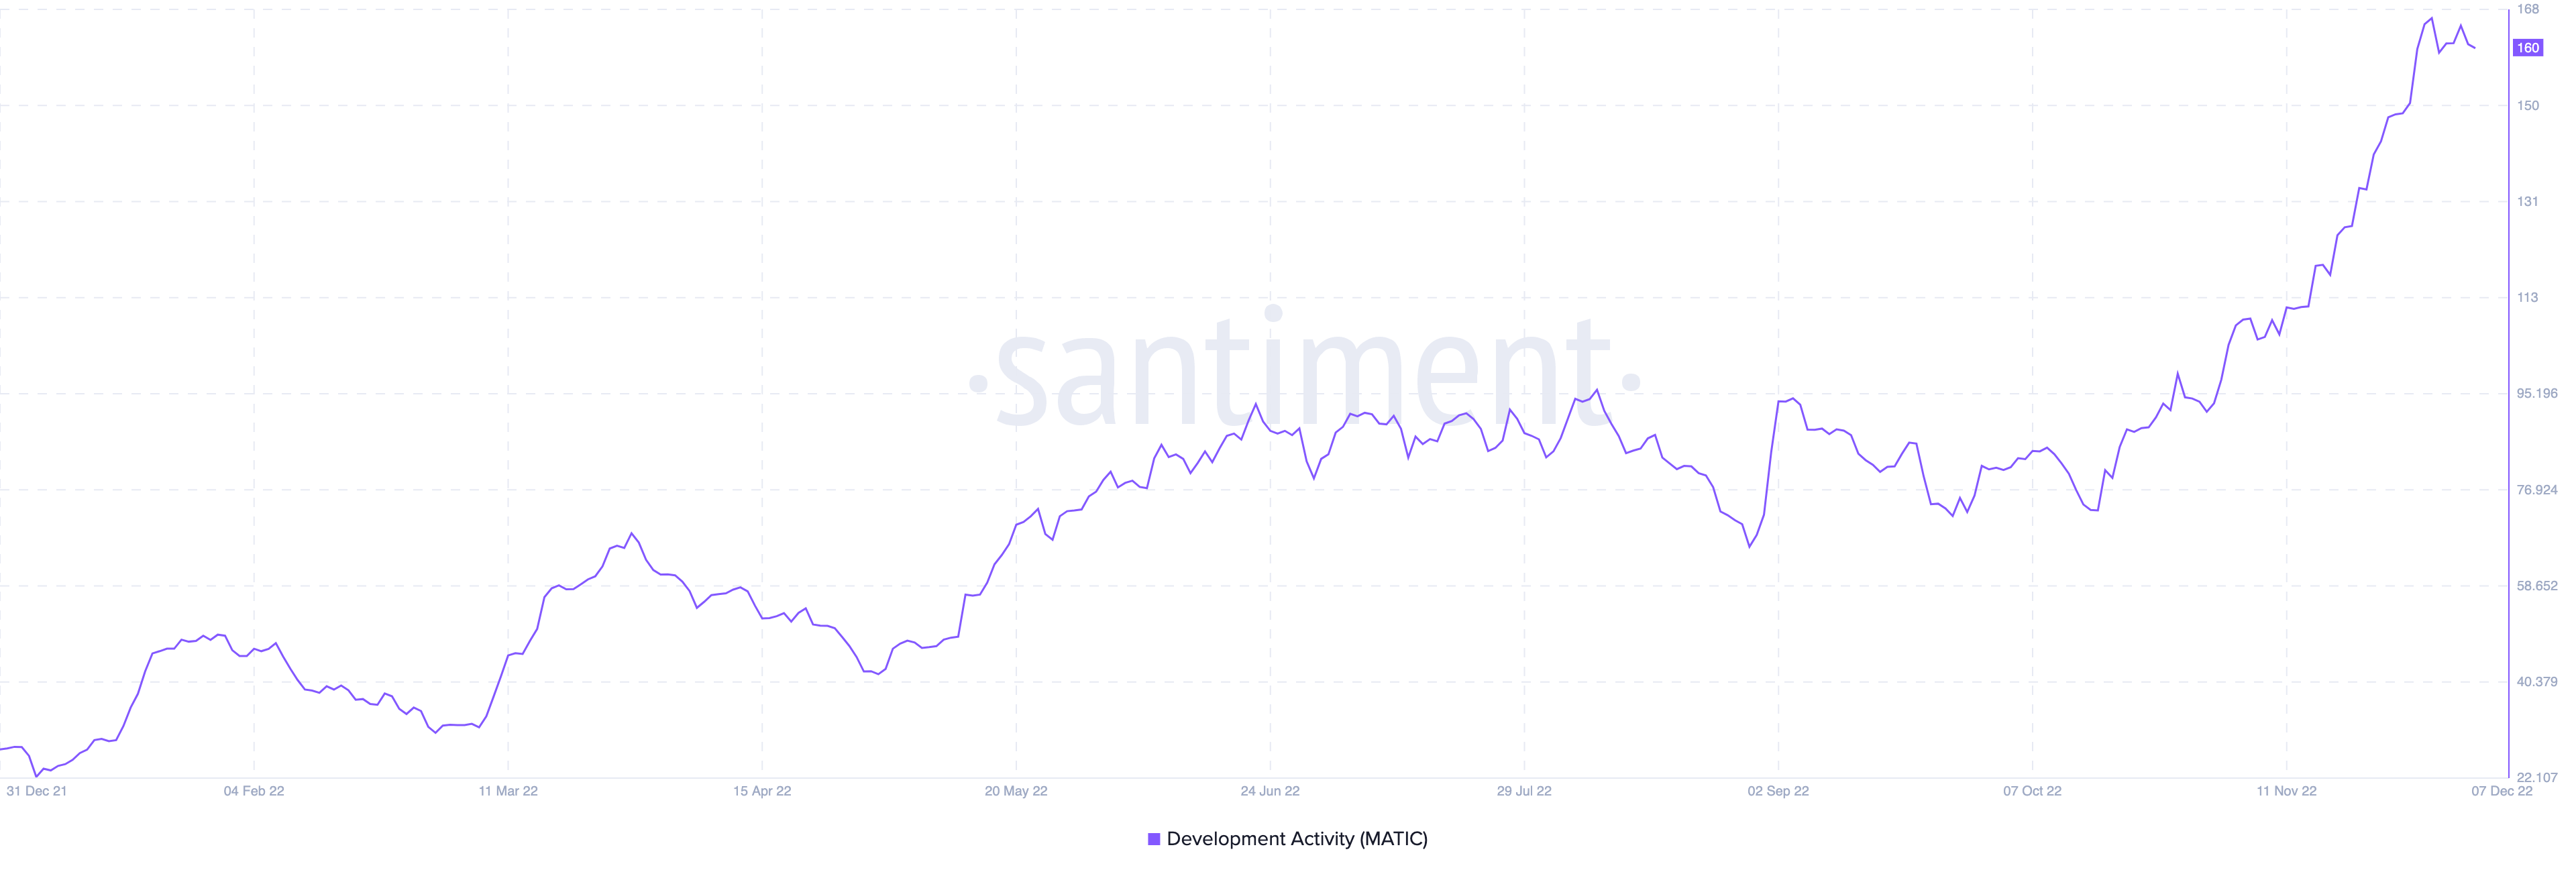
MATIC Development Activity | Source: Santiment
MATIC’s development activity metric has seen an incredible jump. According to data from Santiment, MATIC’s numbers have gone up from around 28 at the beginning of the year to around 160 as of writing. That presents a staggering 470% jump in the development activity on the Polygon network in the duration of 2022.
Daily active address trend
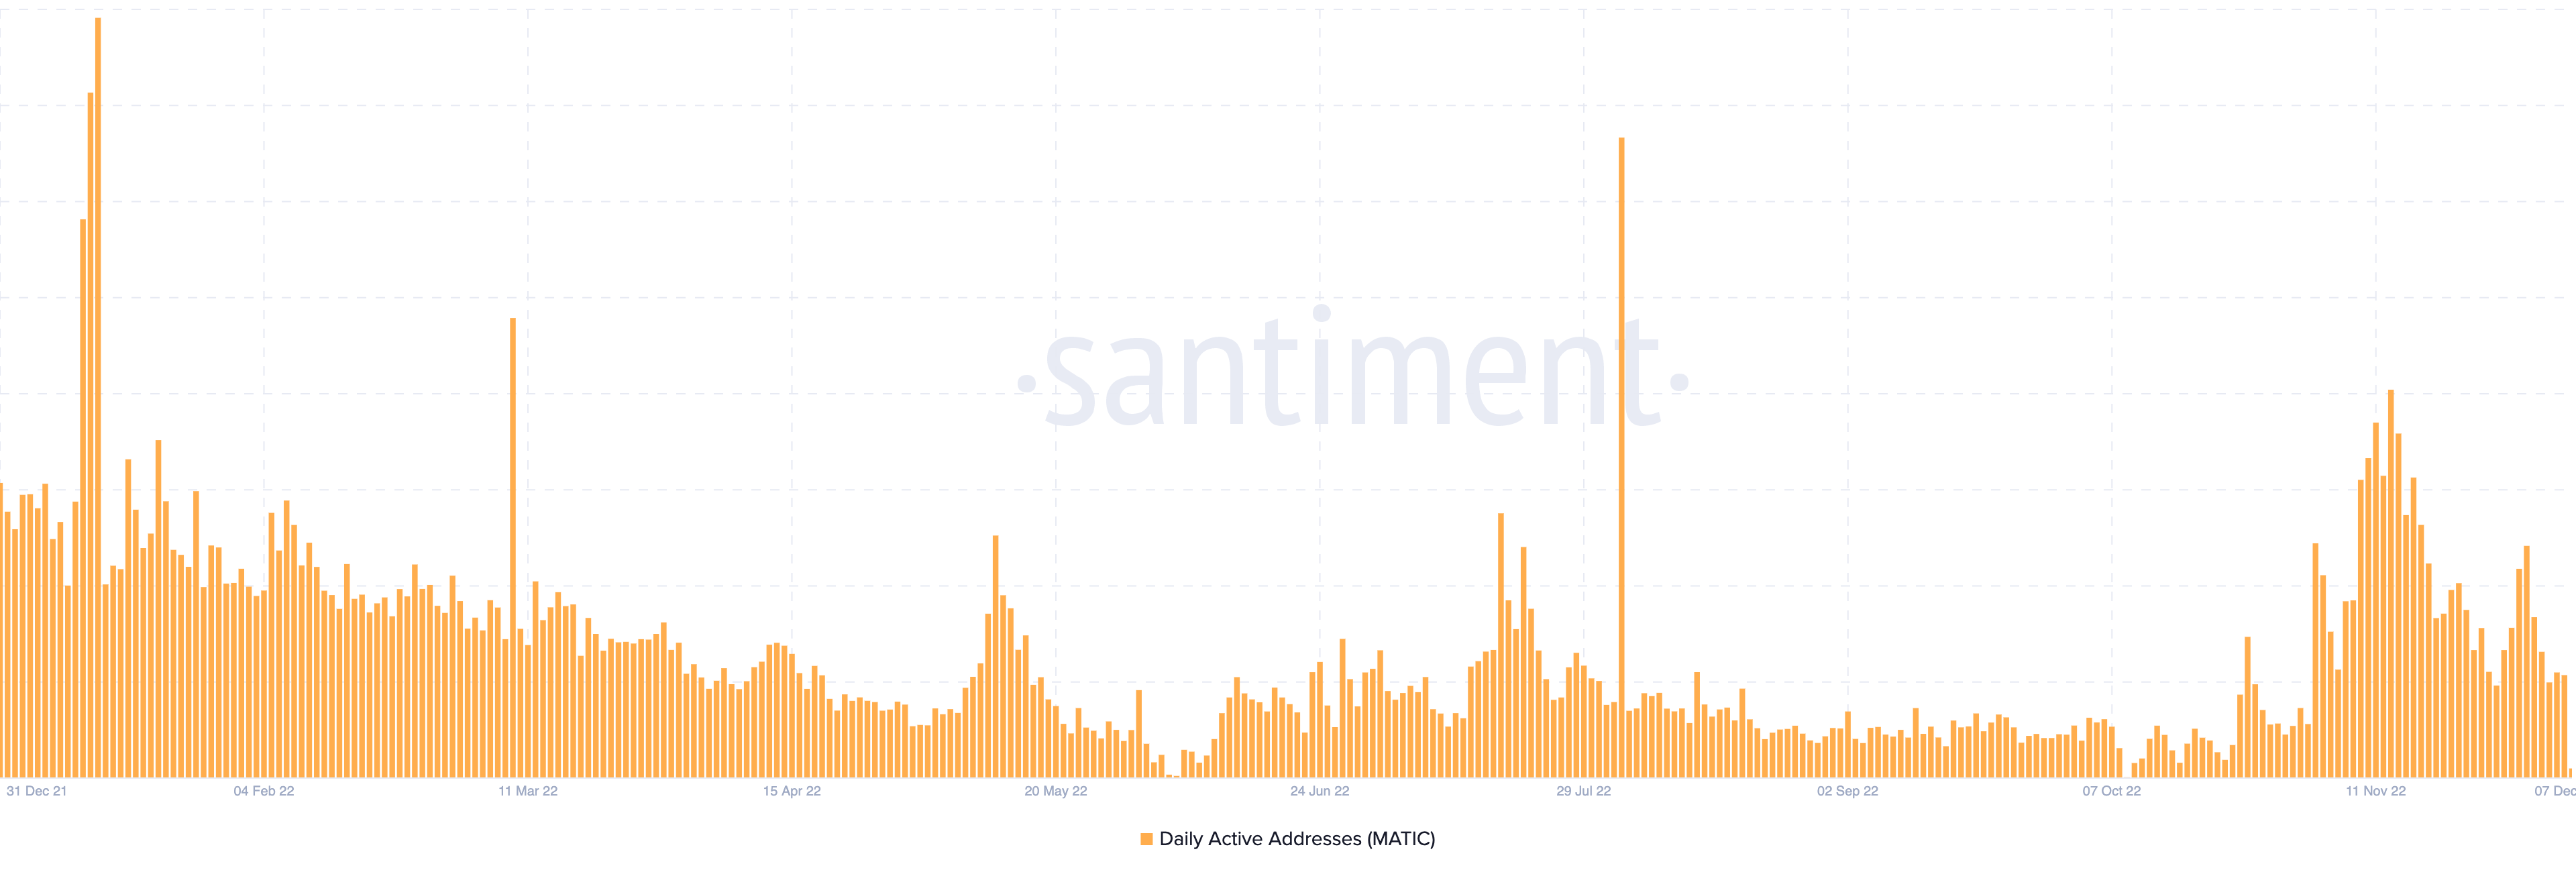
MATIC Daily Active Addresses | Source: Santiment
The daily active addresses is another metric that has been decently good for the Polygon network. While the metric did see a major dip through the months of May to October 2022, it quickly gained a lot of momentum in the month of November 2022. So, this particular metric has more or less stayed within manageable territory and didn’t see major uptrend, apart from a few spikes here and there.
Network growth trend
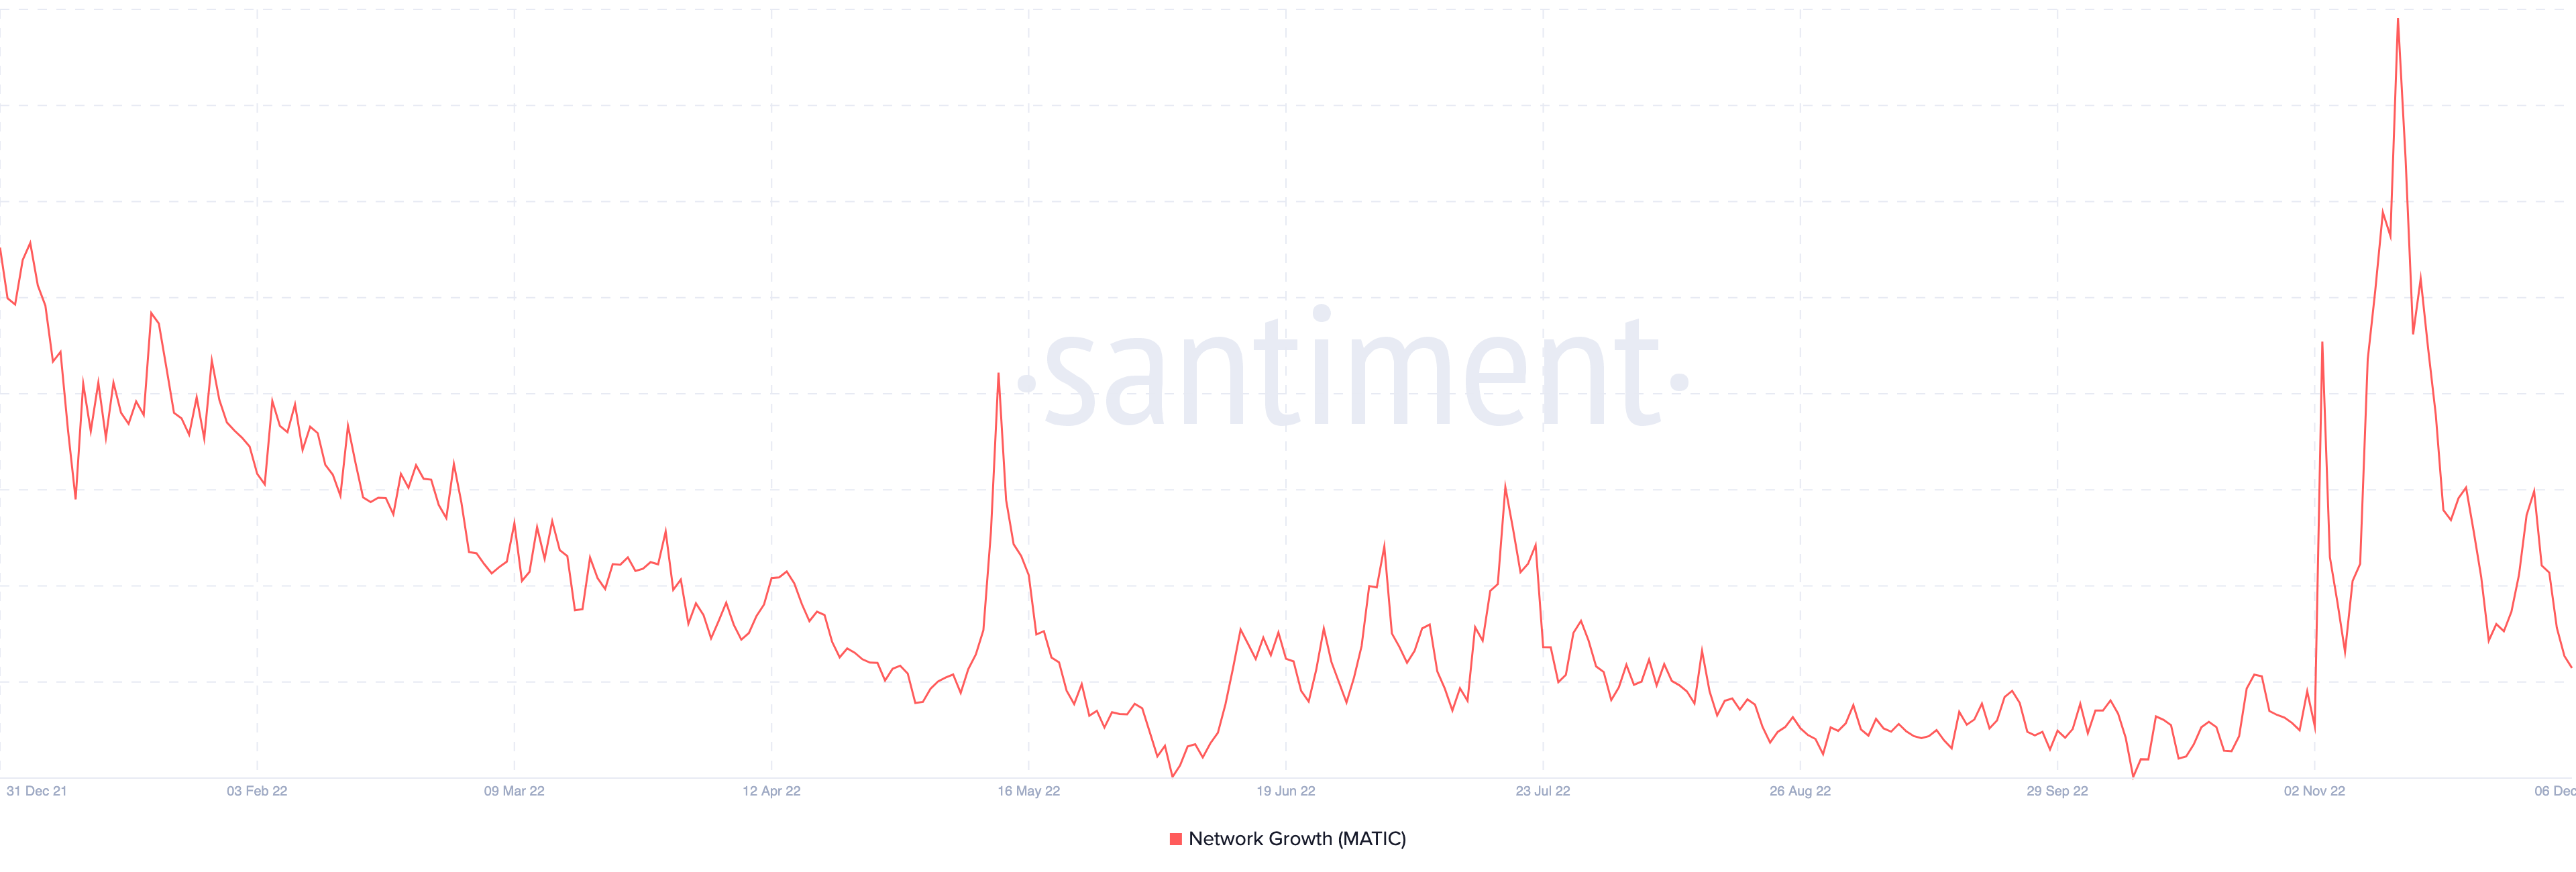
MATIC Network Growth | Source: Santiment
According to official definition, network growth is a metric that measure the amount of new addresses that transferred a given coin or a token for the first time. Essentially, this chart illustrates user adoption over time and is typically used to identify when the project is gaining or losing traction.
Thus in the case of MATIC, the beginning of the year saw a dip in the network growth as the market began to come to terms with the emerging bear run that was ensuing but since May 2022, post the Terra LUNA crash, MATIC’s network growth has been improving and has been on somewhat of an uptrend which solidified in the month of November, post the FTX crypto exchange collapse.
Supply on exchanges – DOWN 44%!
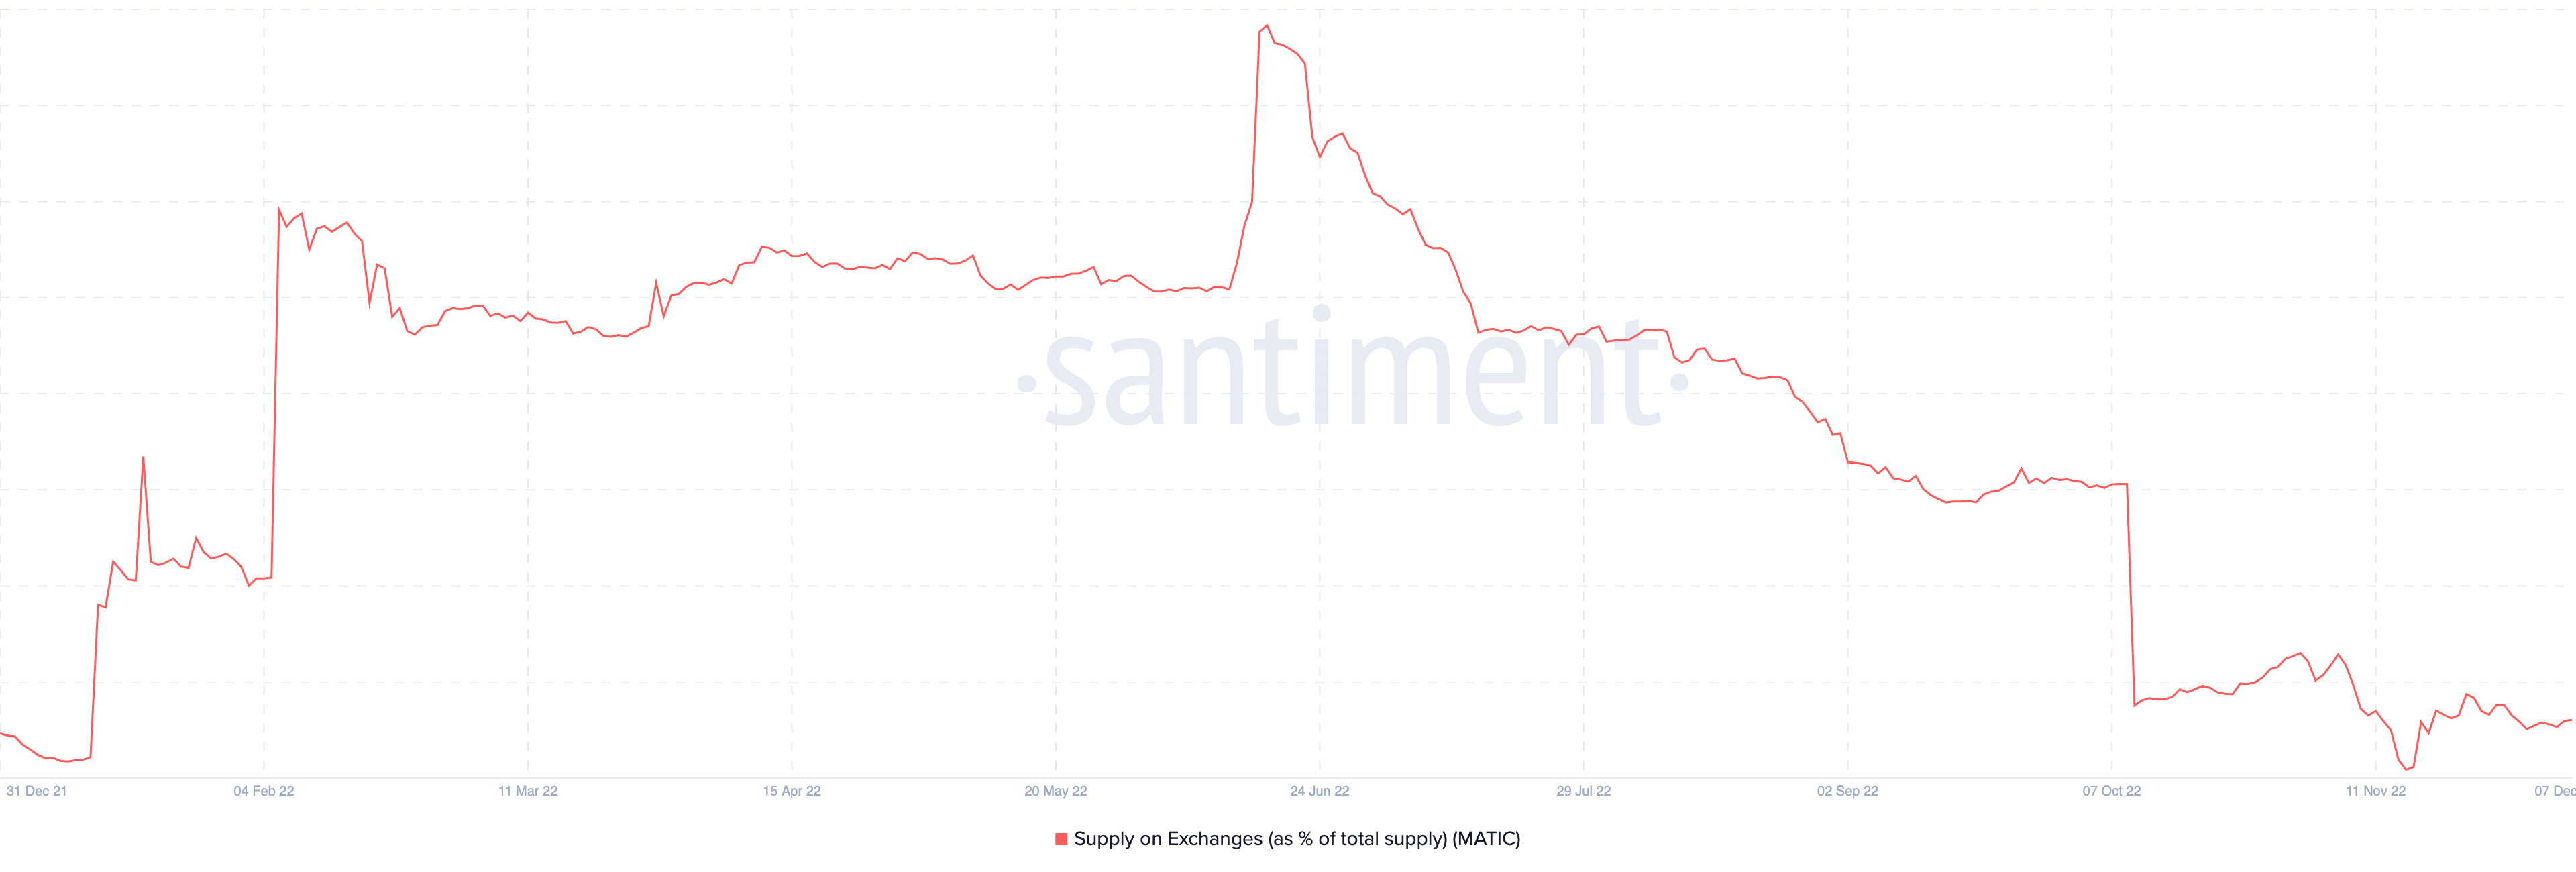
MATIC Supply on Exchanges | Source: Santiment
Supply on exchange as a percentage of total supply is another pretty important metric that essentially tries to measure HODLer sentiment as a whole. Quite similar to the network growth metric, the beginning of the year for MATIC’s supply on exchanges had been increasing thanks to increasing FUD around the token and weaker hands moving to sell their holdings and book profits. However, on the other hand, ever since June 2022, when MATIC touched its YTD lows – we see a reversal in that trend as supply on exchanges begin to fall sharply, indicating strong HODLing sentiment and people essentially buying the dip.
In terms of numbers, MATIC saw a dip of 44% from its June levels to as of writing this article, which strongly attests to the observation made above.
Social dominance – DOWN 85%!
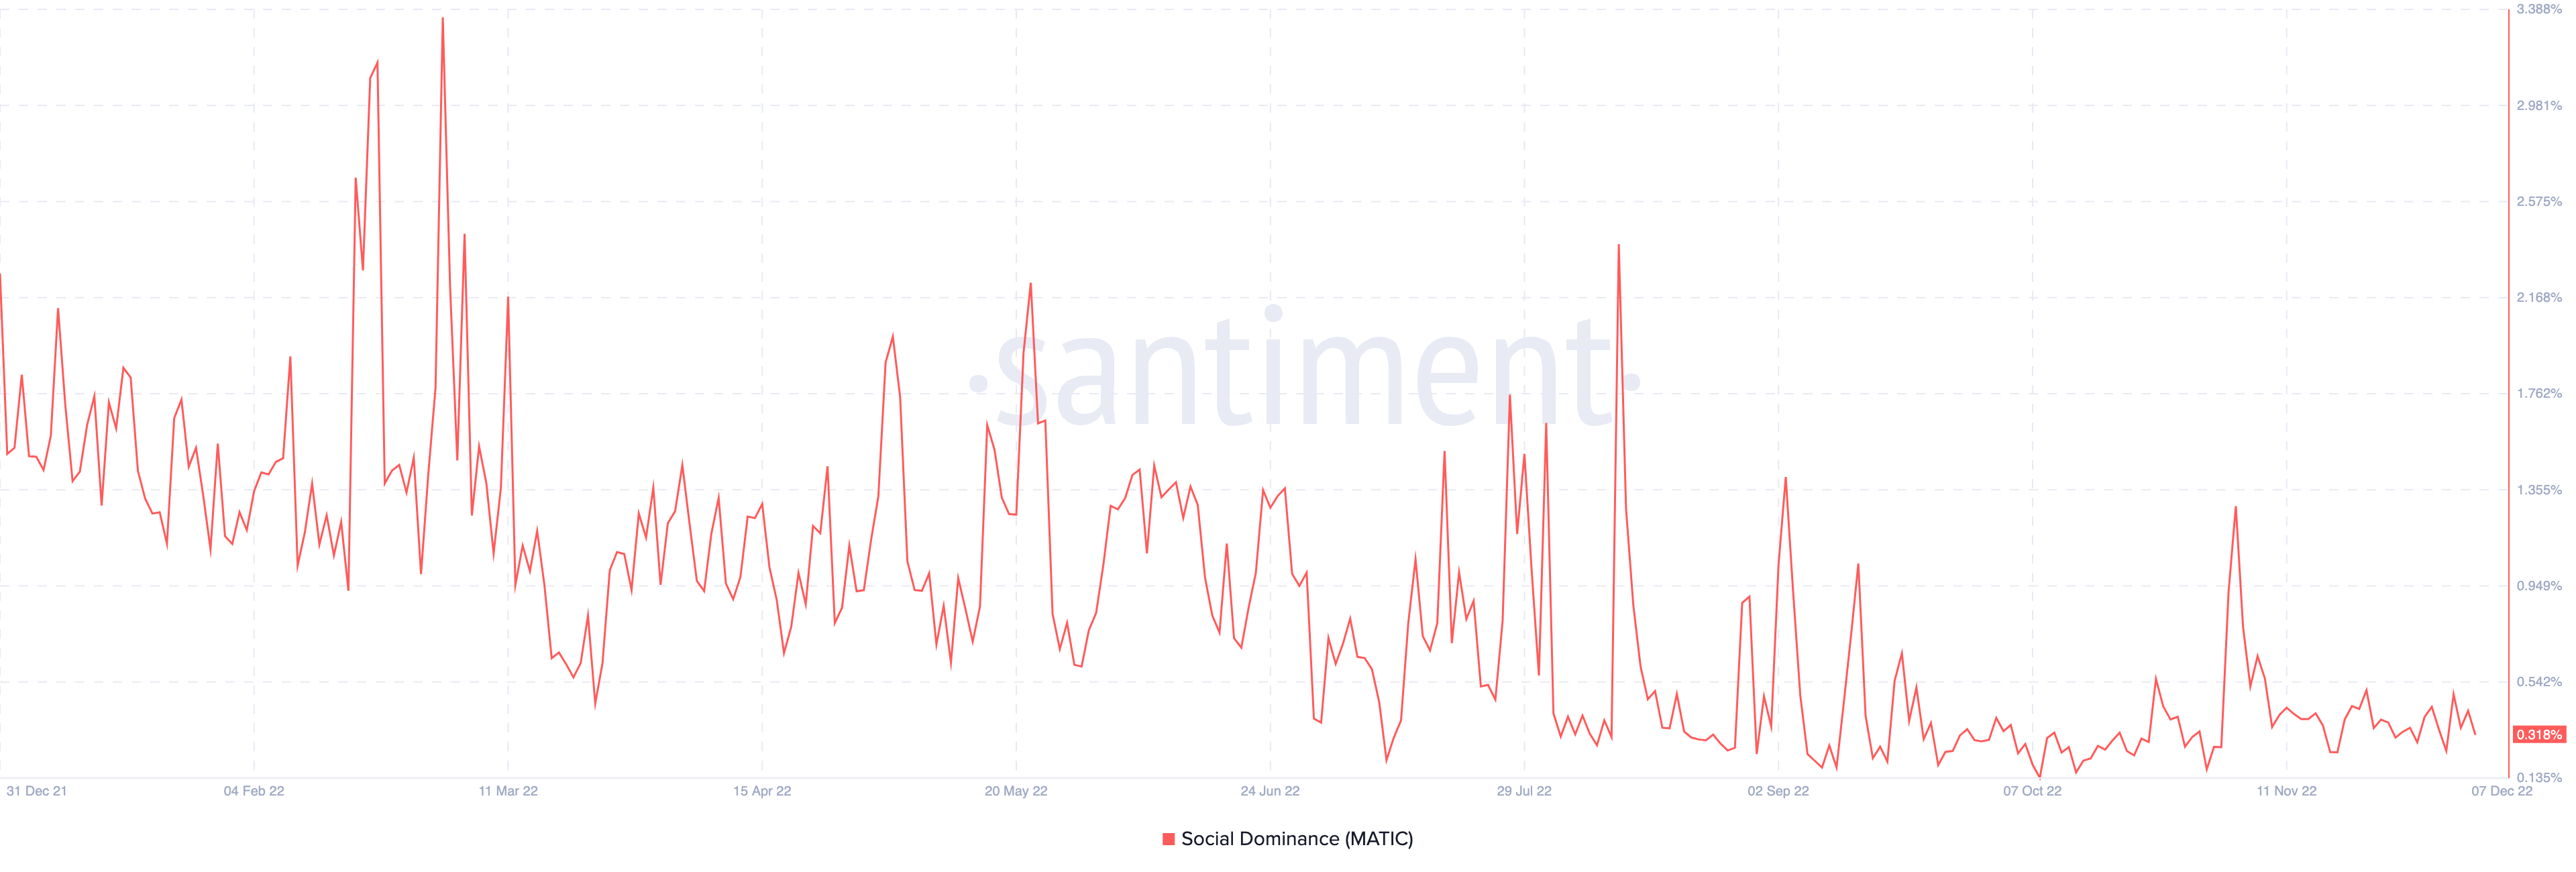
MATIC Social Dominance | Source: Santiment
MATIC’s social dominance has been on the downtrend, and is on the bearish side, quite unlike all the other metrics we have looked at. However, this is nothing out of the ordinary as bear markets typically reduce investor interest in an asset class and only major HODLers are able to keep their interests up. Hence during bear markets, social dominance does take a hit and nothing too much to worry about, despite having fallen from over 2% at the beginning of the year down to 0.3% as of writing – which happens to be a near 85% dip in social dominance for the token.
Read more: Top Altcoins 2023
Related posts

Bitcoin Price Hits New All-Time High Following Fed’s 25-Basis-Point Rate Cut
Fed’s interest rate cut spurs crypto momentum, boosting Bitcoin and Ethereum prices.

Blum Secures Major Investment from TOP to Strengthen DeFi Presence in TON Ecosystem
TOP’s backing aims to accelerate Blum’s multi-blockchain expansion.