Key Takeaways:
- Ethereum maintains a 43% dominance in the DeFi ecosystem in terms of TVL.
- Bitcoin vs Ethereum ‘Flippening’ index stands at 45.9% (by market capitalization).
- Ethereum transactions count takes a dip in the last couple of days.
- Ethereum’s validator count has been rising steadily since the beginning of 2022.
- Ethereum’s Fear & Greed Index at 33 – hinting at fear in the market.
- Ethereum holder data indicates now 50% of all addresses are in losses while only 46% remain in the green.
Ethereum is the second largest crypto by market capitalization and it is most well known for introducing the concept of smart, programmable money to the world of crypto. Ethereum was thus instrumental in bringing about the decentralized finance (DeFi) revolution that we know today. It is by far, the second most traded crypto in the entire market – with 24 hour volumes of over $7 billion (excluding stablecoins), second only to the king coin itself – Bitcoin.
Now that we know how popular Ethereum is, let’s take a look at some of the broader indications that you can use to take your first trade in Ethereum too.
ETHEREUM MAINTAINS TVL DOMINANCE
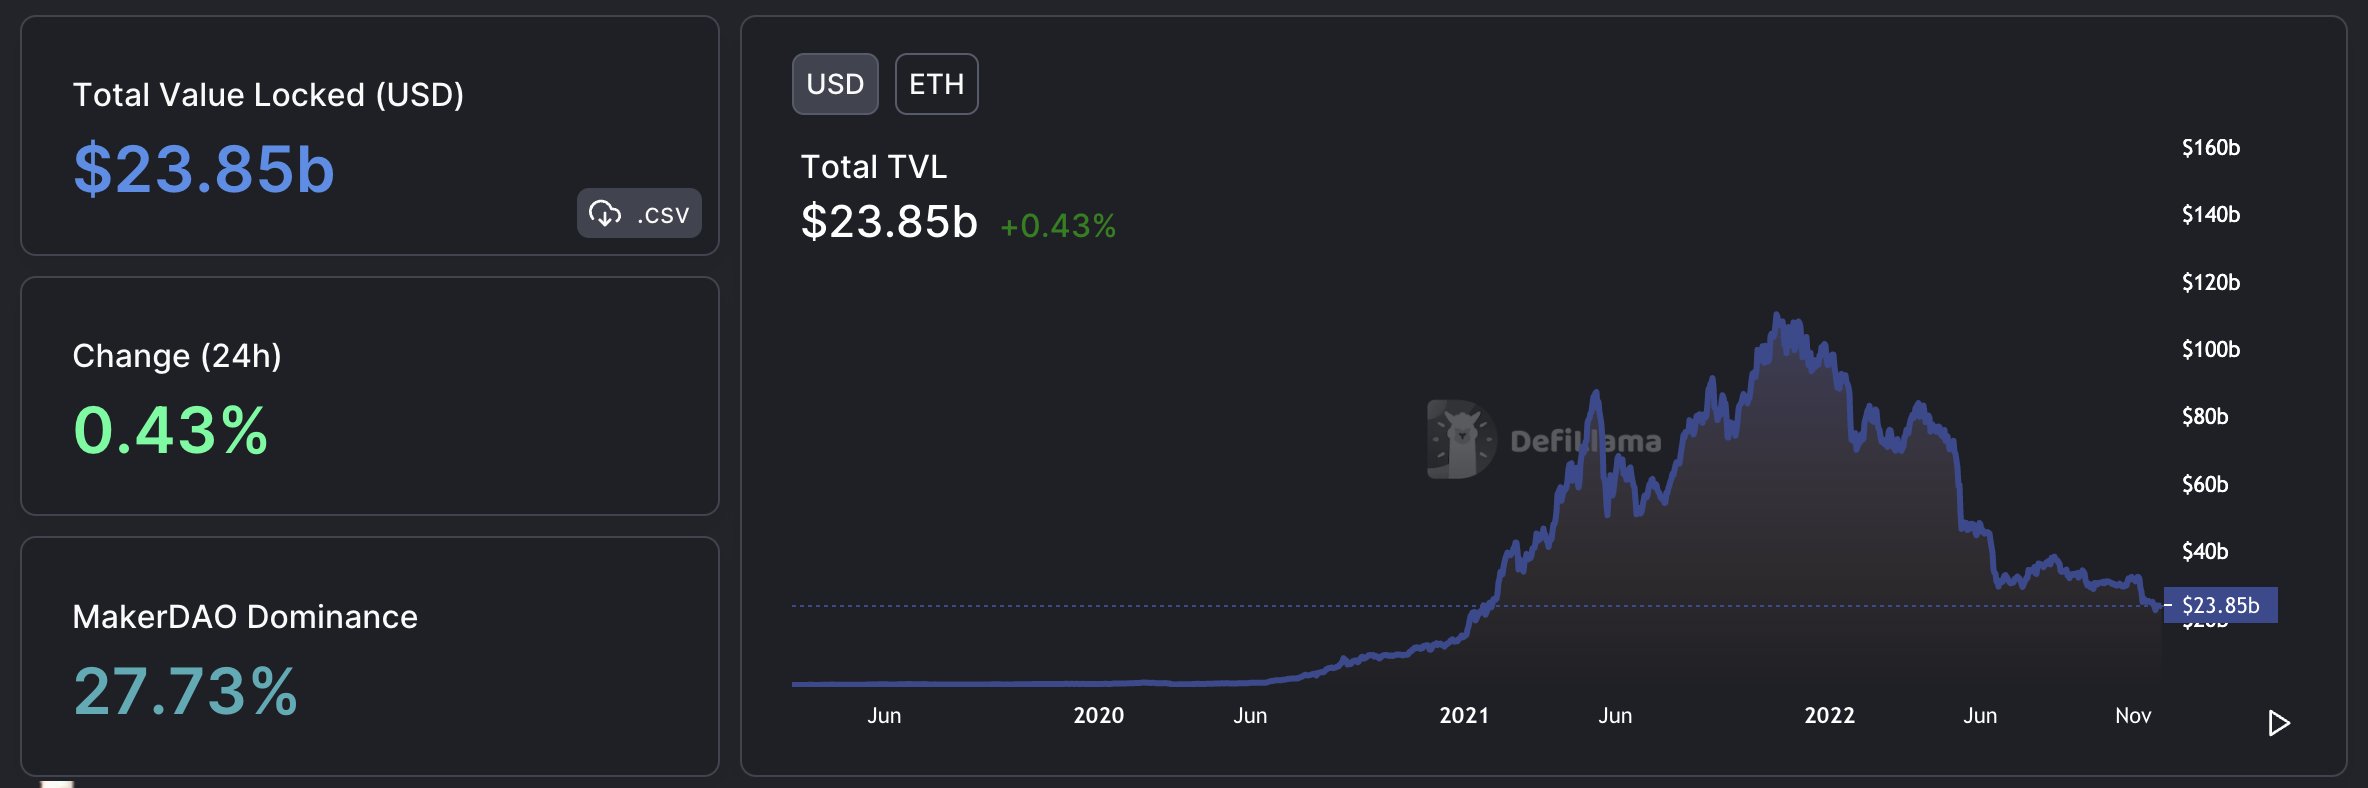
Ethereum Total-Value-Locked | Source: DefiLlama
According to data sourced from DefiLlama, as of writing the complete total-value-locked (TVL) in smart contracts in the entire crypto space stands at about $41.6 billion, out of which $23.85 billion is contributed by Ethereum alone. This translates to a near 43% dominance over the entire DeFi ecosystem that Ethereum is in control of. This indicates how big and expansive the Ethereum ecosystem is and the effect it has on the ecosystem as a whole.
ETHEREUM’S FLIPPENING INDEX STANDS AT 45.9%
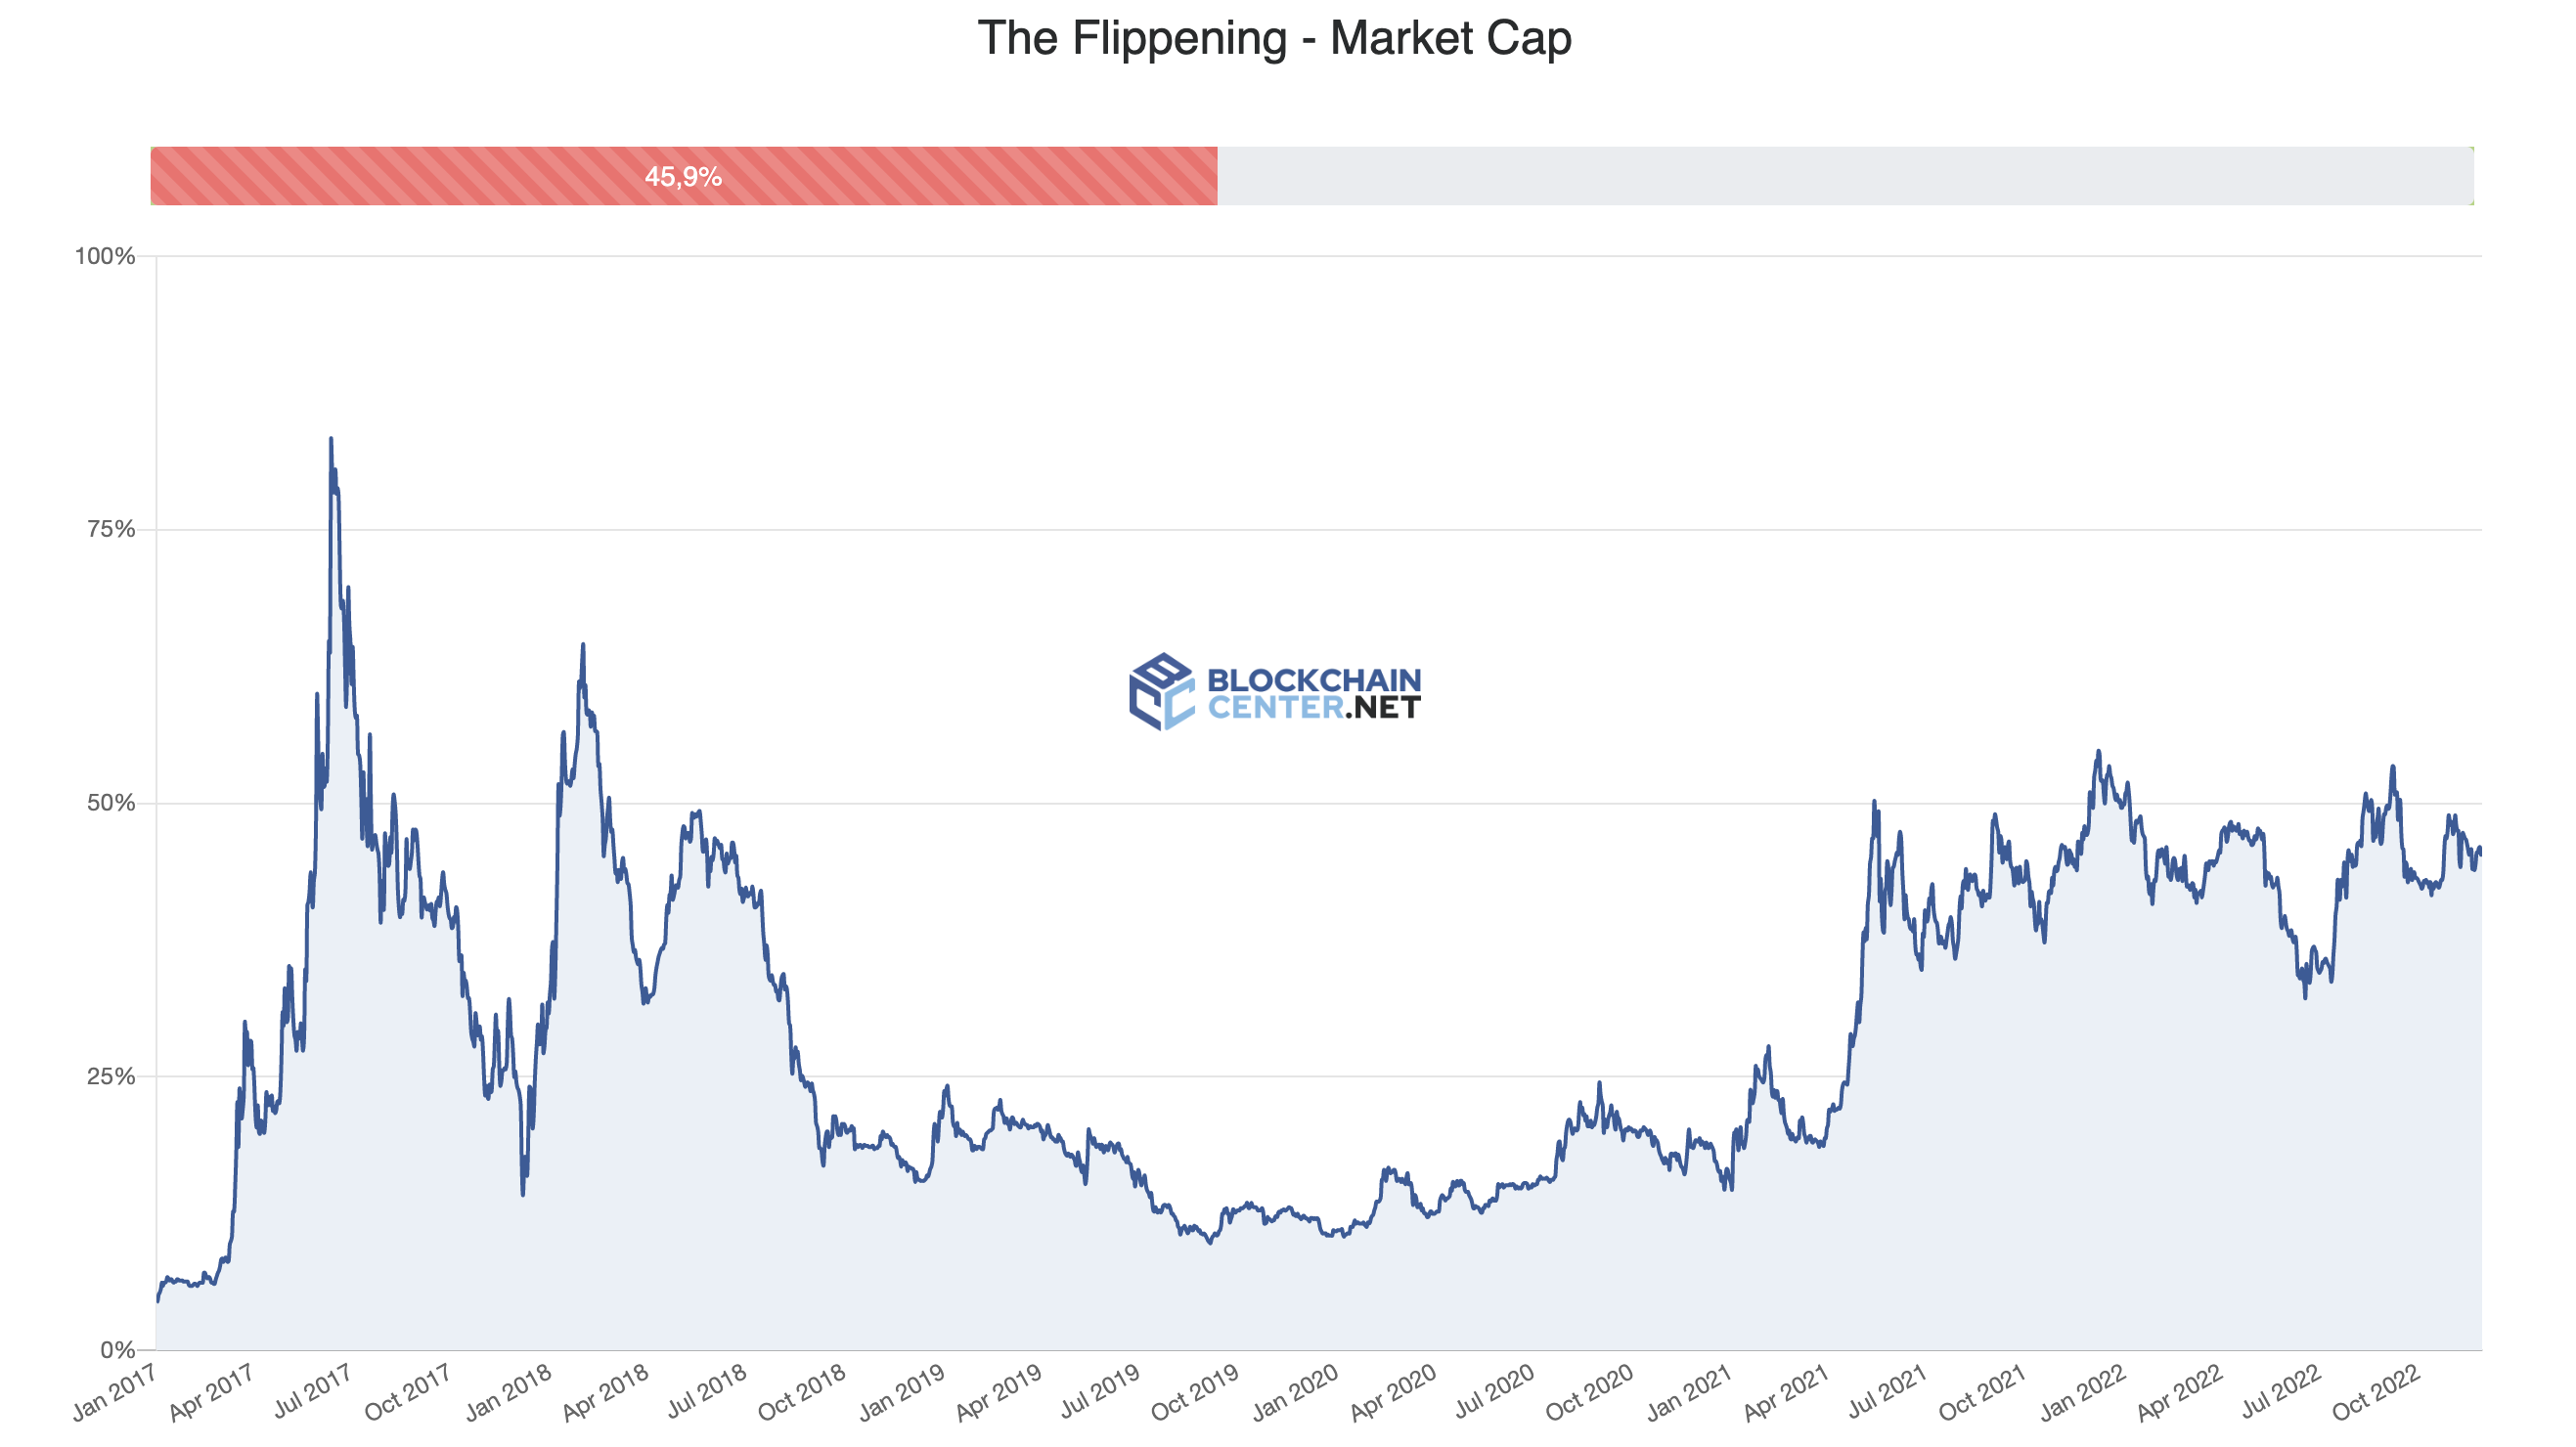
Ethereum Flippening Index | Source: Blockchaincenter.net
Now what is a flippening index? ‘Flippening’ is a term that was coined back in 2017 and it simply refers to the hypothetical situation where Ethereum’s (EHT) market capitalization exceeds that of Bitcoin’s (BTC) and dethrones it as the biggest crypto. So essentially, – a 100% on the chart above means both Bitcoin and Ethereum at that point in time have the same market capitalization – anything below means Bitcoin is ahead and anything above would result in the flippening – or the overtaking of Bitcoin by Ethereum.
This is an exciting moment in the world of crypto since it basically signifies the overtaking of an older and outdated technology by a newer and more efficient one. While market cap is only one of the metrics to look at the flippening – there are several other metrics that are looked at while measuring the potential flippening, ranging all the way from active addresses, transaction count, transaction volume to social interest – all these are also looked at.
Read more: Etheruem Price Prediction
ETHEREUM TRANSACTIONS COUNT ON THE LOWER SIDE
Ethereum Transactions Count | Source: Messari.io
Ethereum’s transaction count has more or less stable, with a slightly weaker bias. There have been the occasional spikes here and there, especially in the beginning of August 2022 – when the ETH price had attempted to stage a recovery. However, of late – Ethereum’s on-chain transactions have been on the lower side – creating a lower high, lower low pattern (line marked in blue).
This is along expected lines as ETH price took a hit in the last couple of days – and also the overall crypto bear market has been affecting the sentiment too which has affected on-chain transaction count too.
ETHEREUM VALIDATOR COUNT RISING STEADILY
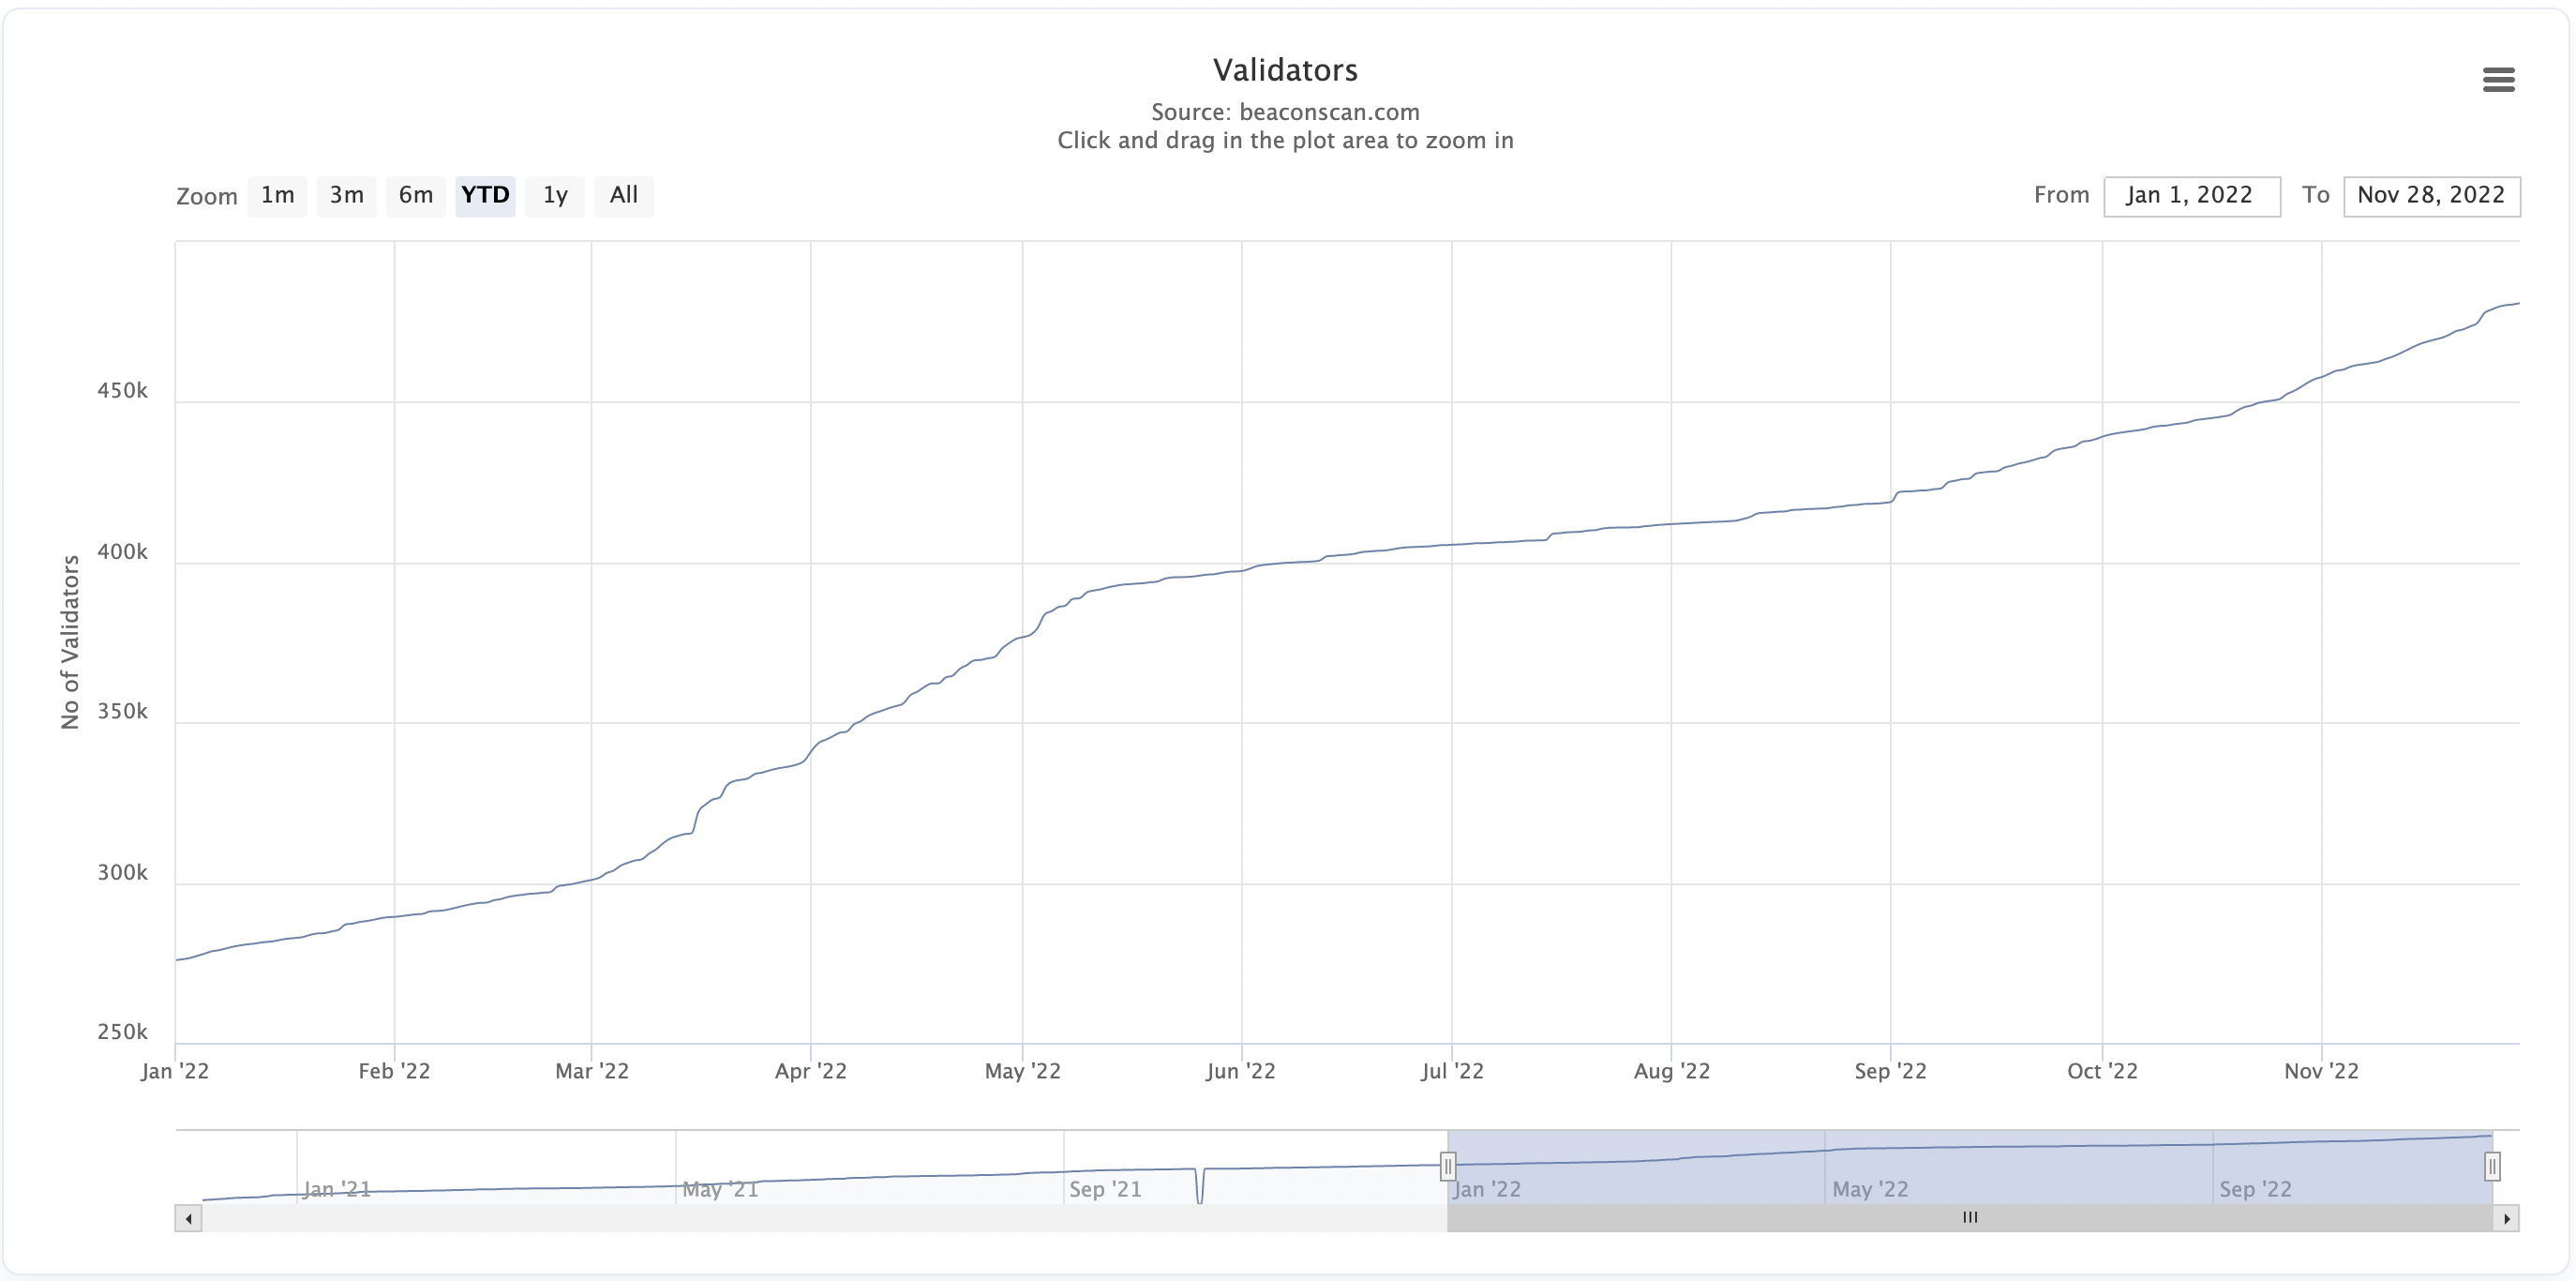
Ethereum Validator Count | Source: Beaconscan.com
According to data from Beaconscan.com – the number of validators on the proof-of-stake (PoS) based Ethereum network has been rising steadily ever since the beginning of the year. The proof-of-stake based Beacon chain which was launched about two years ago and recently merged with the Ethereum mainnet.
Additional read: Ethereum Merge Update
This indicates strong confidence and intention to become a validator in the updated version of Ethereum which has moved from a less efficient proof-of-work (PoW) consensus mechanism to a PoS one back in September 2022. More and more people are interested to stake upwards of 32 ETH (the minimum amount) to become a validator and try to gain rewards by providing security to the network.
ETHEREUM FEAR AND GREED INDEX AT 33
Ethereum Fear and Greed Index is 33 – Fear
Current price: $1,170https://t.co/Ye8sACrbxQhttps://t.co/dpxABnTHOM pic.twitter.com/FsBBHV3YSY— Ethereum Fear and Greed Index (@EthereumFear) November 29, 2022
The Ethereum Fear & Greed Index has slipped into the fear territory over the past week, especially in the last few days thanks to the FTT token crash and the FUD around FTX crypto exchange. This is a multi-factoral crypto market analysis that analyses the sentiments of the market participants. It does so by calculating several metrics including volatility, market momentum, volume and social media sentiment of a particular crypto, in this case, Ethereum.
ETHEREUM HOLDER DATA: 50% OF HOLDERS NOW IN LOSSES
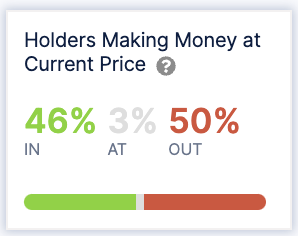
Ethereum Holder Data | Source: IntoTheBlock
According to data from IntoTheBlock – about 50% of the holders are below their purchase price on their Ethereum investments. Along with that, about 46% are in the money, which means they are still holding on to some unrealized gains on the books while the remaining 3% are at break-even.
Additional read: Etheruem Shanghai Upgrade
CONCLUSION
Thus in conclusion from the above observations, we can say that Ethereum’s current situation looks moderately bearish as of now. Extreme fear still persists in the market, but it is mainly still an aftereffect of the bear run that Ethereum has faced since the beginning of the year. However, the strong validator count, which is rising steadily indicates there is still a lot of underlying interest in the crypto project as a whole – and hence an overall improvement in the market sentiment is sure to revive this crypto’s spirits.
Values as on 29 November, 2022.
Related posts
Bitcoin Price Hits New All-Time High Following Fed’s 25-Basis-Point Rate Cut
Fed’s interest rate cut spurs crypto momentum, boosting Bitcoin and Ethereum prices.
Blum Secures Major Investment from TOP to Strengthen DeFi Presence in TON Ecosystem
TOP’s backing aims to accelerate Blum’s multi-blockchain expansion.