Key Takeaways:
- LINK token price has been one of the better performers in 2023, trading somewhat within a steady range, roughly between $6 to $7.5, despite the overarching bearish theme playing out through the year.
- For the immediate future, the token price seems to be building a bullish momentum; however, as history has shown, this might soon be reversed.
- LINK token price has recovered from the latest Fibonacci pivot S1 level and has rallied all the way to the R1 level near $7.3. A breakout beyond this R1 level would be pretty bullish for the token, with the next target at $7.8 (R2) and the price target after that being at a solid 20% up near $8.7 (R3).
- On the downside, LINK price can find support near $5.5, which is close to the S2 level of the Fibonacci pivot point indicator.
LINK Price Technical Overview
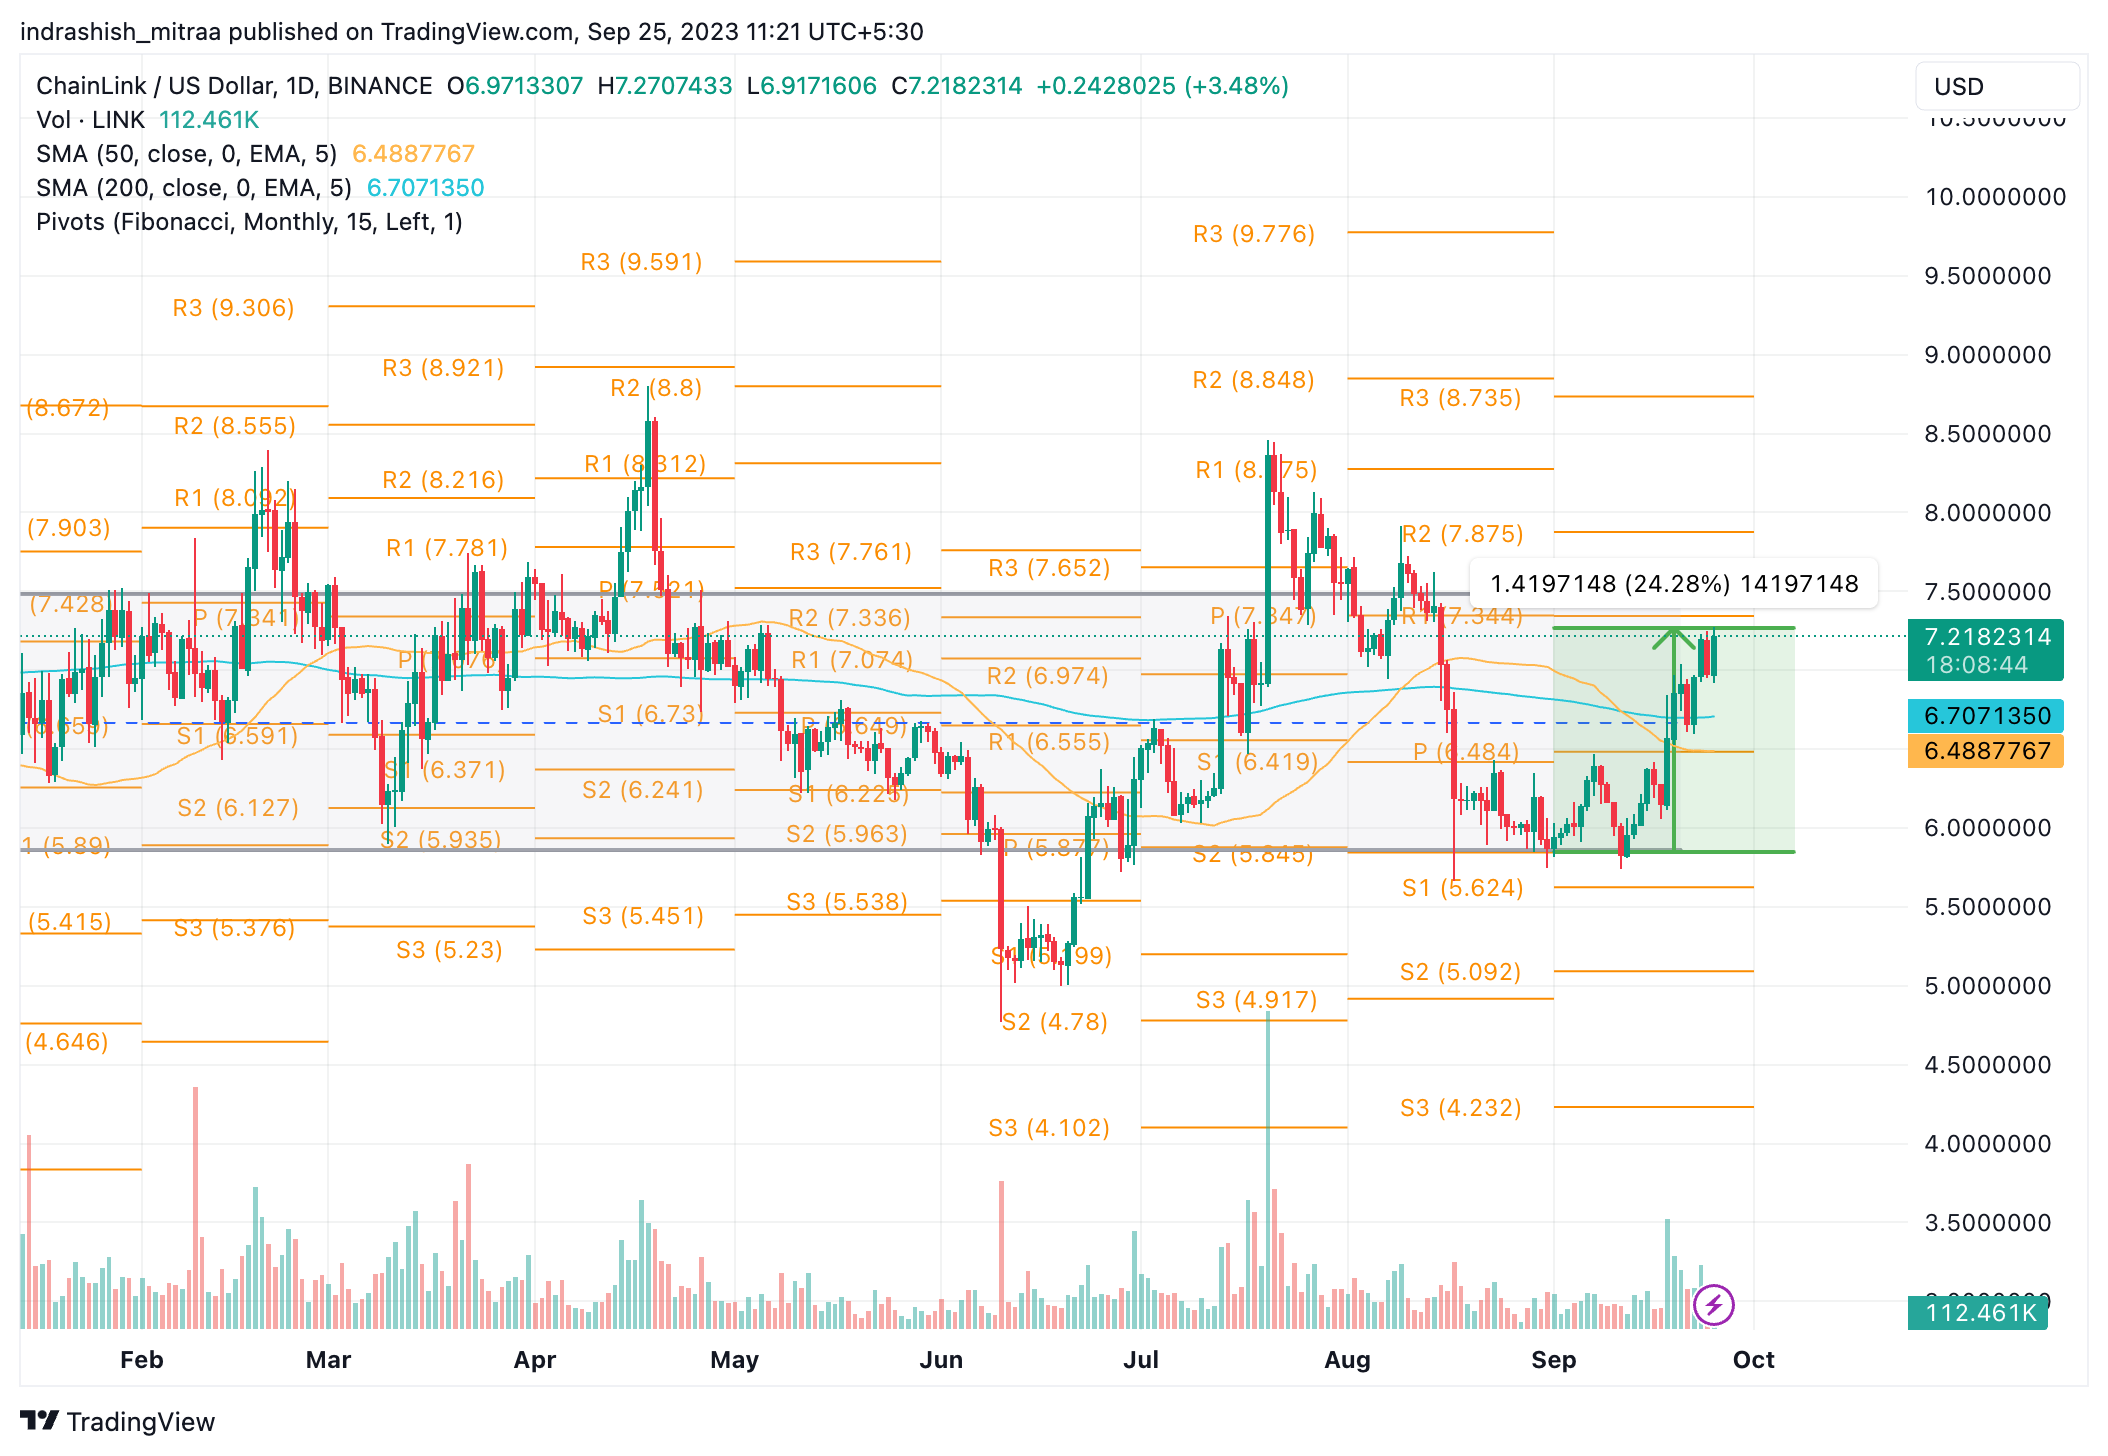
LINK/USD | Source: TradingView
- Chainlink (LINK) has been one of the better performers in 2023, despite the overarching bearish theme playing out through the year. According to CoinMarketCap data, LINK token’s price is up about 20% year-to-date; also, as depicted in the chart above, after a brief crash in August, LINK price made a solid 25% recovery in September as well.
- However, despite the ups and downs in 2023, we can observe that the value of LINK has been trading somewhat within a steady range (marked in grey), roughly between $6 to $7.5.
- This range has held steadily all throughout the year, despite multiple attempts to breach it. LINK price tried to break out of the range on three separate occasions and break down below the range on one occasion, but all of them have been reversed very quickly.
- For the immediate future, LINK price seems to be building bullish momentum; however, as history has shown, this might soon be reversed unless there is a broad base recovery coming into the crypto market.
- In September alone, Chainlink’s price has recovered from the latest Fibonacci pivot S1 level and has rallied all the way till the R1 level near $7.3. A breakout beyond this R1 level would be pretty bullish for the token, with the next target at $7.8 (R2) and the price target after that being at a solid 20% up near $8.7 (R3).
- On the downside, Chainlink’s price might find support near $5.5, which is close to the S2 level of the Fibonacci pivot point indicator.
- Additionally, as long as LINK token’s price manages to stay above the YTD low of $5, there are reasonably strong chances of pullback rallies in the future.
Read On: Chainlink’s CCIP Protocol Enhances Cross-Chain Development
Chainlink On-chain Overview
LINK Supply in Top 100 Addresses Down 4.5% in 2023
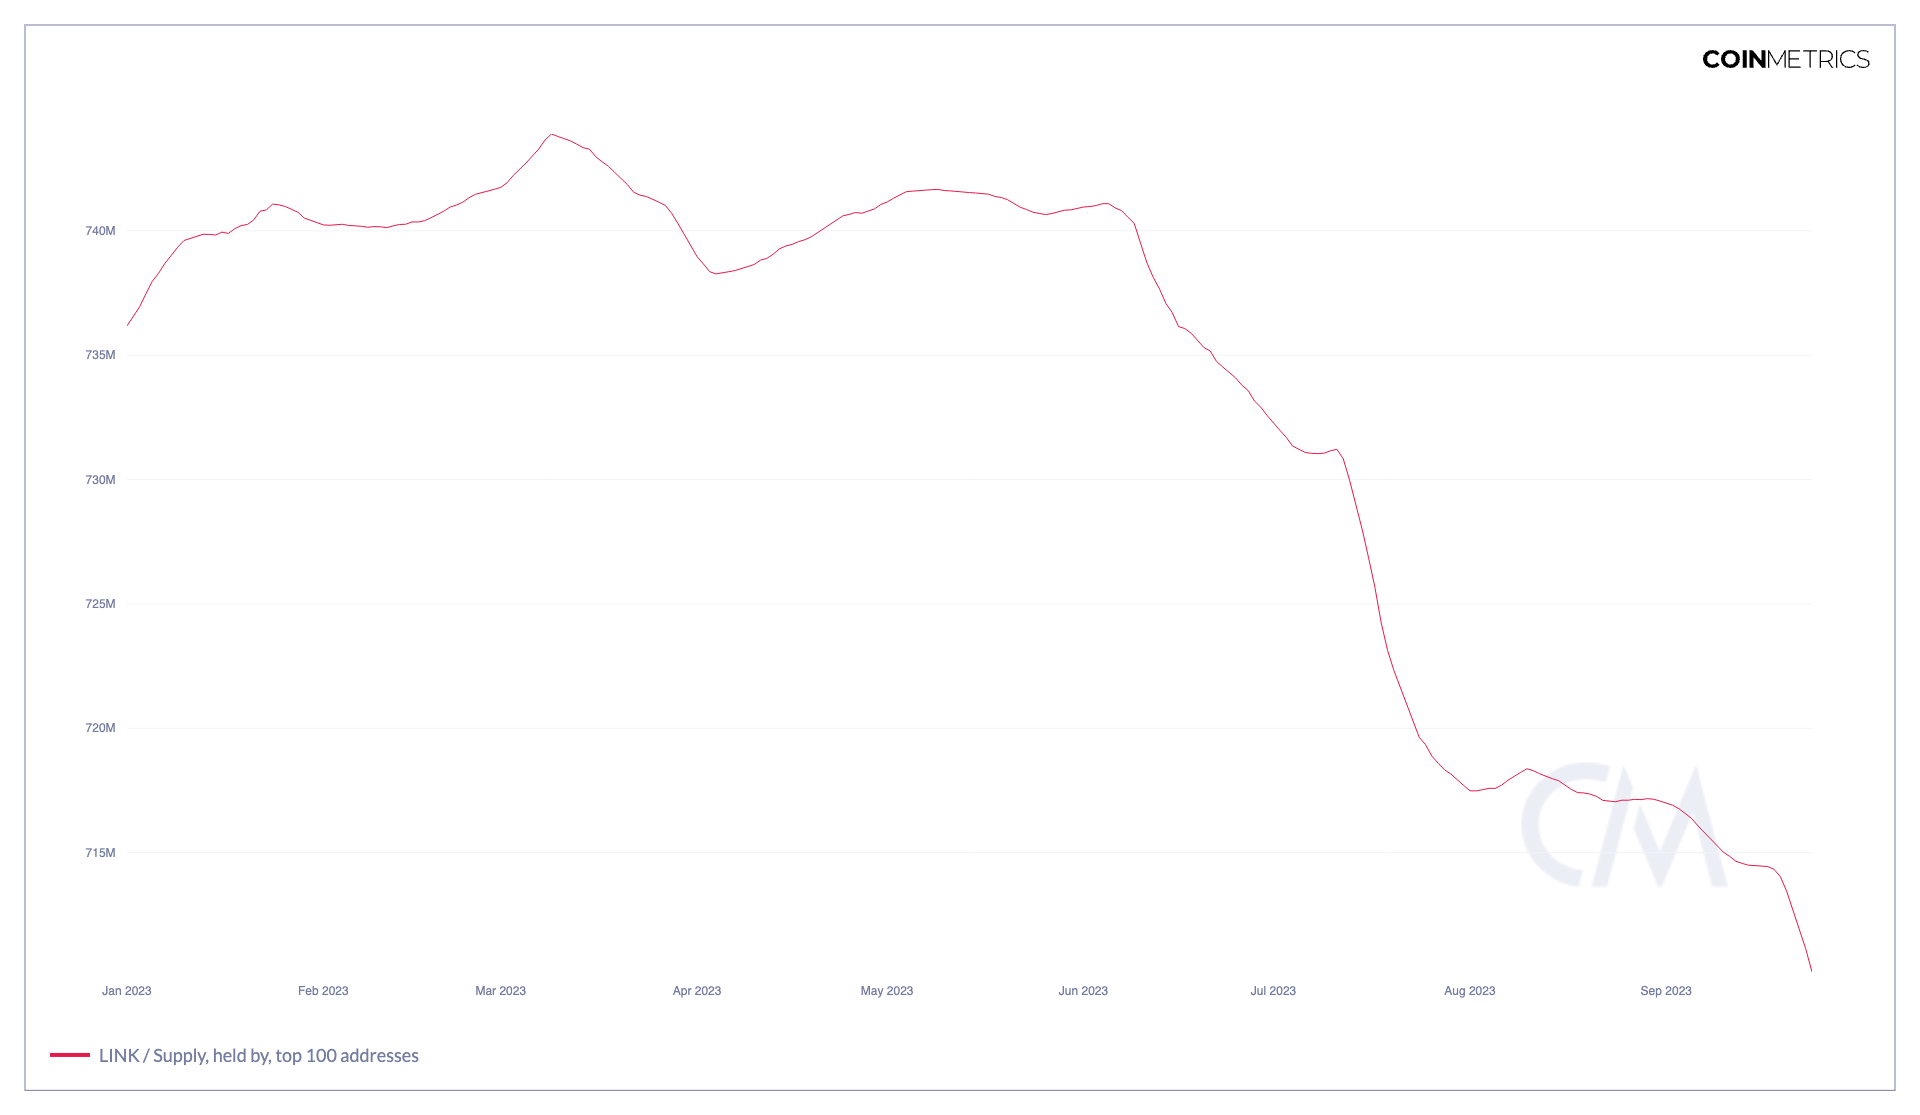
LINK Supply in Top 100 Addresses | Source: Coinmetrics.io
The supply in the top 100 addresses metric is a measure of the concentration of a crypto’s supply among its largest holders. It is calculated by dividing the total amount of crypto held by the top 100 addresses by the total circulating supply. A high supply in the top 100 addresses metric indicates that a relatively small number of people hold crypto. This can make the crypto more volatile, as a small number of large holders can have a significant impact on the price.
A drop in the supply in the top 100 addresses metric can be seen as a positive sign, as it indicates that the crypto is becoming more decentralized. However, the recent drop in Chainlink’s supply in the top 100 addresses from 744 million to 710 million, a 4.5% fall, can also be interpreted as a sign that heavyweight holders of this altcoin might be losing confidence and are offloading some of their holdings to reduce risk. Thus, this becomes an important metric to keep an eye out for.
LINK Active Address Count
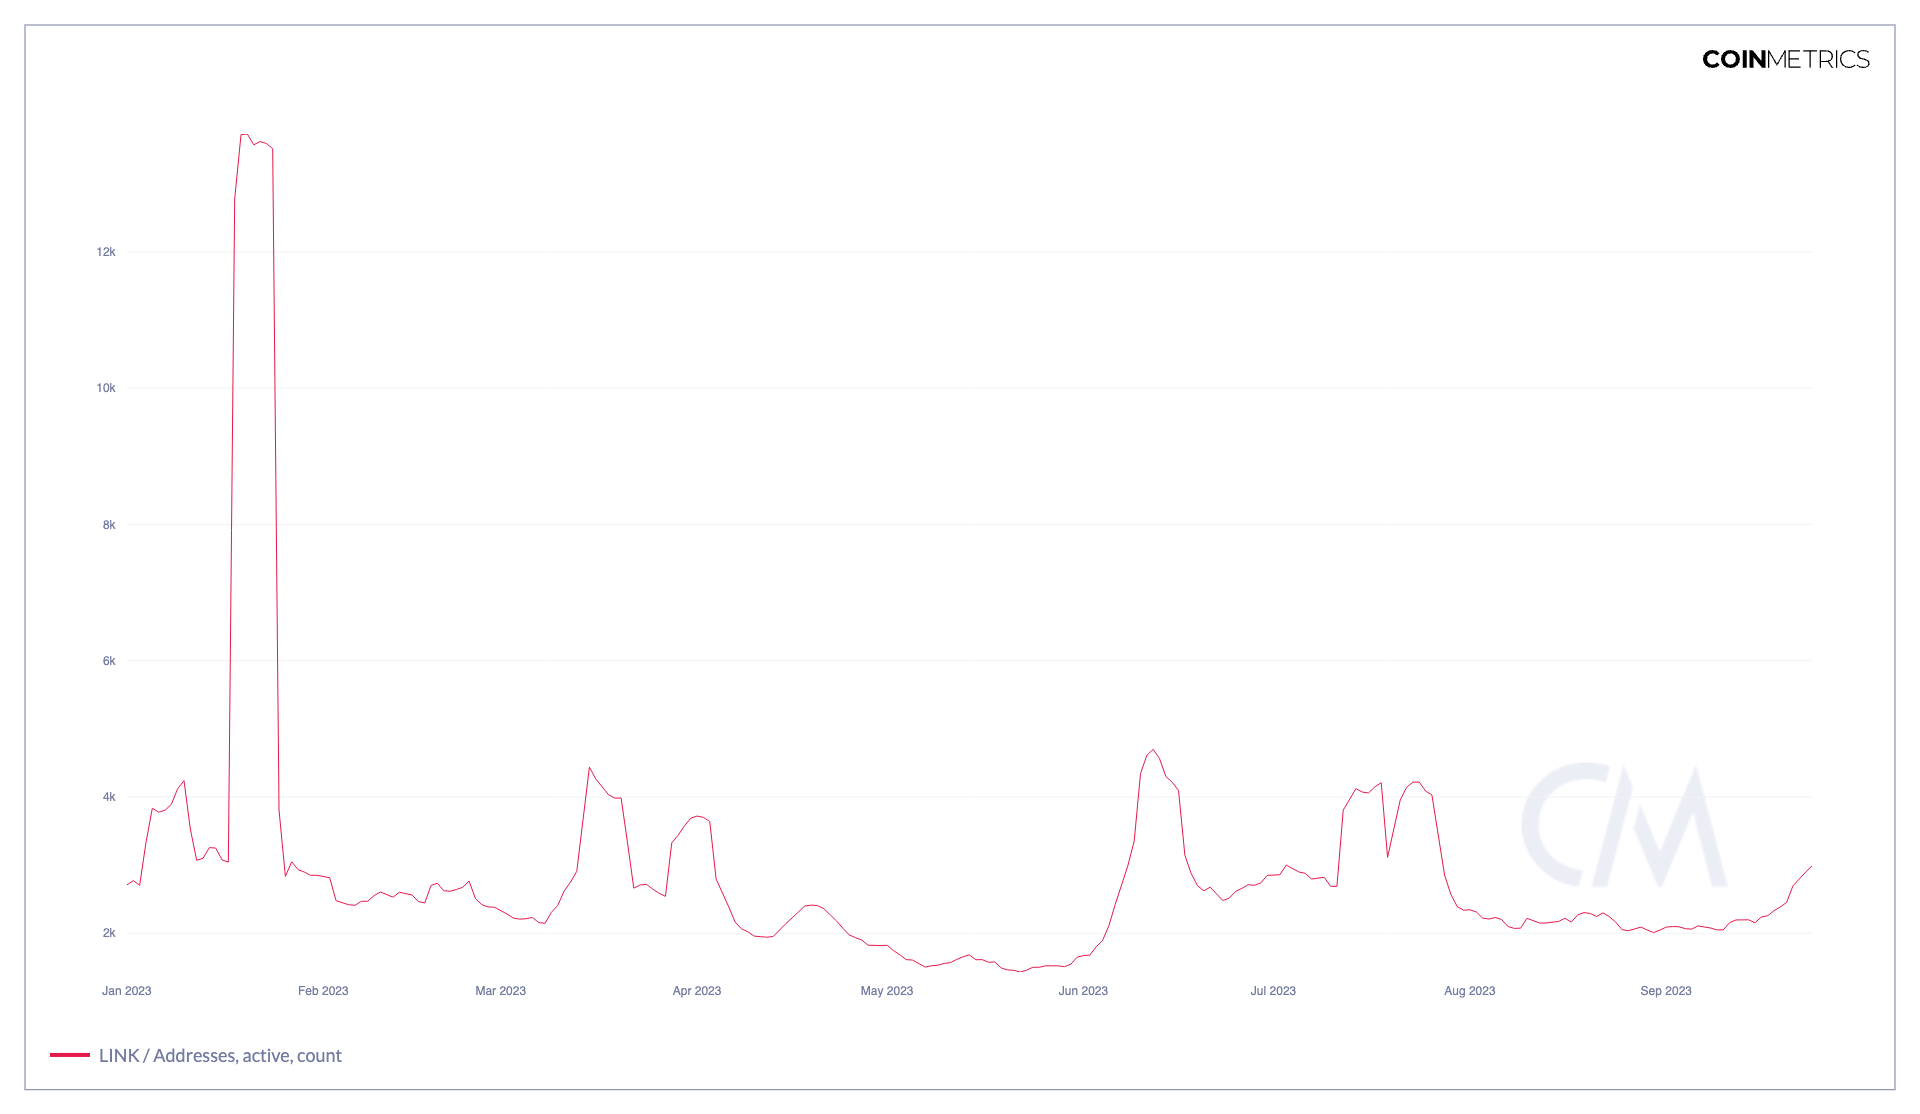
LINK Active Address Count | Source: Coinmetrics.io
Chainlink’s active address count is a measure of the number of unique addresses that have interacted with the Chainlink network in a given period of time. It is calculated by counting the number of unique addresses that have sent or received Chainlink tokens or that have interacted with a Chainlink smart contract.
An active address count is a measure of the usage of a crypto network. A high active address count indicates that the network is being used by a large number of people. A low active address count indicates that many people are not using the network. Chainlink’s active address count has been stagnant all through 2023, which is not surprising given the current bear market. Bear markets are typically characterized by low trading volume and low user engagement.
Read More: Terra Classic Community Votes to Halt USTC Token Minting
Conclusion
Chainlink’s price performance in 2023 has been relatively impressive, given the overall bearish market conditions. However, it is important to note that LINK price has been trading within a relatively tight range for most of the year. A breakout above the current range would be suggestive of a bullish signal, while a breakdown below the range would be a bearish signal.
It is also important to monitor the supply in the top 100 addresses metric and the active address count metric. A drop in the supply in the top 100 addresses metric can be seen as a positive sign, as it indicates that the crypto is becoming more decentralized. A stagnant active address count is not necessarily a bad thing, given the current bear market conditions. However, it is something to keep an eye on in the future.
Overall, Chainlink stands as a promising project with strong fundamentals. Nevertheless, investors should conduct their thorough research and be aware of the risks involved before investing in any crypto.
Related posts

Bitcoin Price Hits New All-Time High Following Fed’s 25-Basis-Point Rate Cut
Fed’s interest rate cut spurs crypto momentum, boosting Bitcoin and Ethereum prices.
Blum Secures Major Investment from TOP to Strengthen DeFi Presence in TON Ecosystem
TOP’s backing aims to accelerate Blum’s multi-blockchain expansion.