
Key Takeaways:
- Bitcoin’s stability around crucial moving averages signals the continued bullish sentiment.
- Shiba Inu’s resilient recovery indicates potential for further gains, despite resistance.
- Uniswap’s struggle against resistance and Maker’s breakout attempt highlight varied altcoin dynamics.
- Technical indicators like RSI and moving averages offer insights into possible price trends.
- Traders monitor breakout patterns and support levels for informed decision-making.
Introduction
Bitcoin price is poised to create two consecutive Doji candlestick patterns on its weekly charts. A notable positive aspect is that the price is maintaining its position above the 20-week exponential moving average, which stands at $28,072. This resilience suggests that the bullish sentiment remains intact.
While some altcoins seek guidance from Bitcoin’s performance, others have exhibited a strong short-term outperformance. Let’s analyze the charts of the top five cryptos that are displaying positive indications in the coming days.
Read More: Bitcoin Price Prediction
Bitcoin Price Analysis
Bitcoin has been trading in proximity to the 20-day Exponential Moving Average (EMA) which stands at $29,447, signaling a state of indecision between bullish and bearish forces.
The presence of relatively flat moving averages and the Relative Strength Index (RSI) near the midpoint implies a lack of clear advantage for either the bulls or bears. This situation might confine the BTC/USDT pair within the range of $28,585 to $30,150 for a duration.
The impending significant price movement will likely commence once the price surpasses this range. A decline below $28,585 could trigger increased selling momentum, potentially leading the pair to plummet to $26,000.
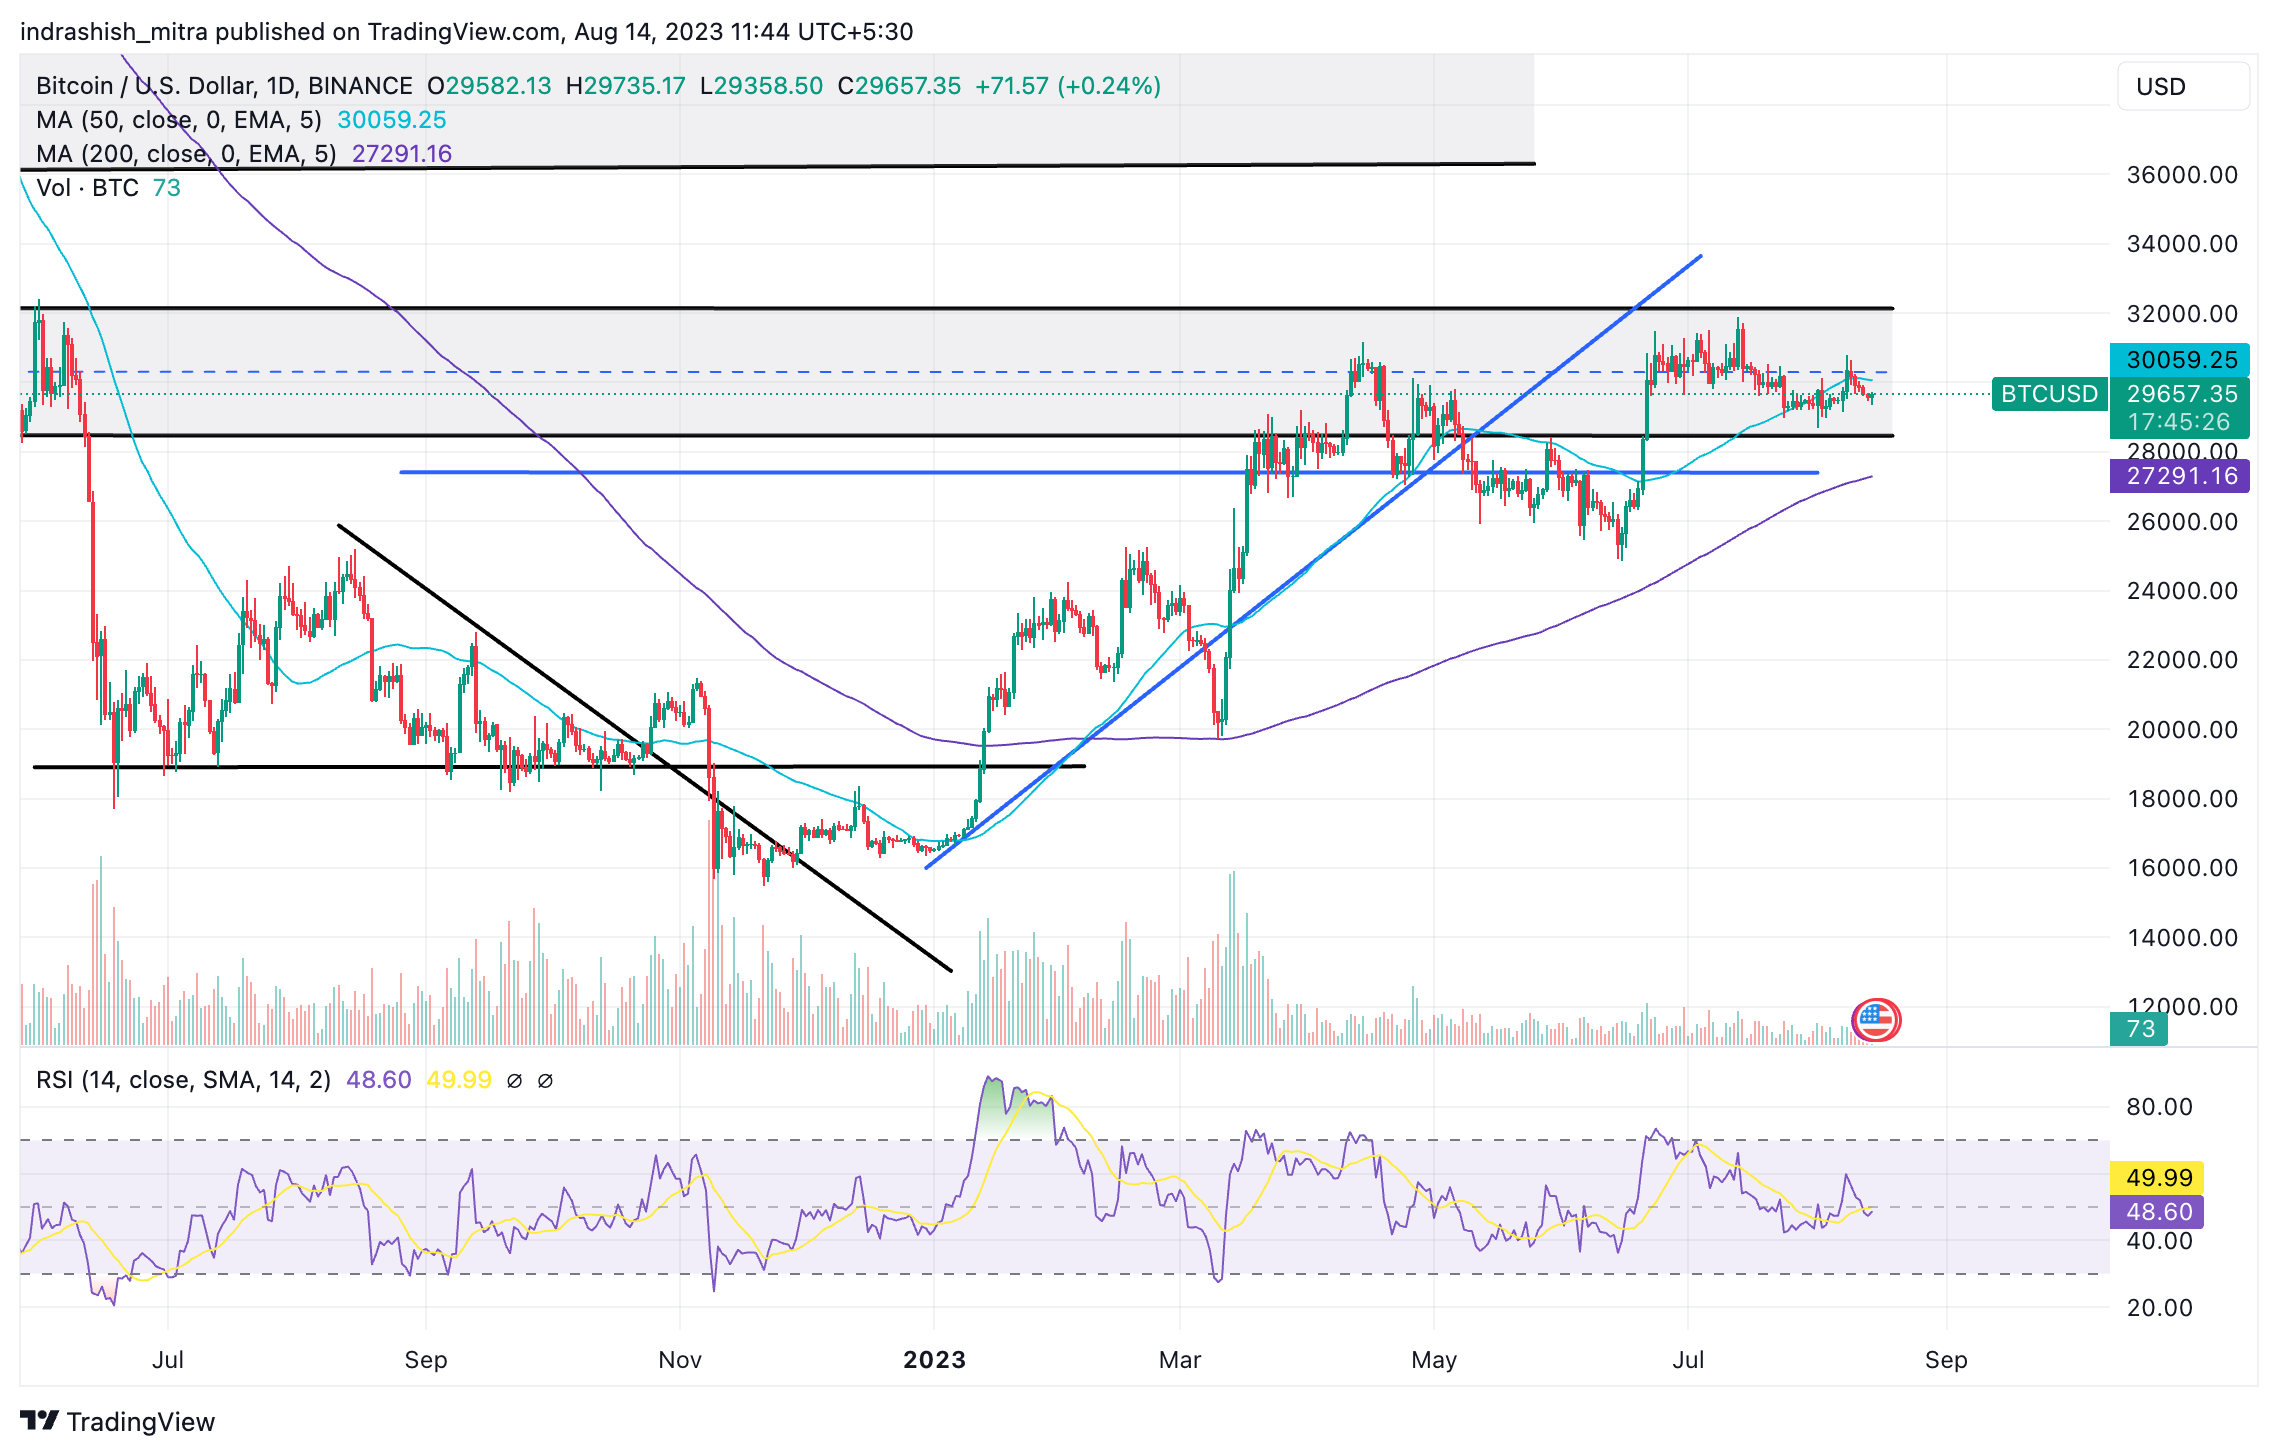
BTC/USD | Source: TradingView
On a positive note, a breakout and successful closure above $30,150 could draw in buyers, potentially propelling the pair to the resistance zone spanning from $31,804 to $32,400.
The four-hour chart further reveals the price being caught amidst moving averages, indicating an uncertain trajectory for the next substantial movement. A closure below the 50-day Simple Moving Average (SMA) might tilt the short-term advantage in favor of bears, potentially pushing the price towards $29,000 and subsequently to $28,585.
However, an upward turn and breakthrough above the 20-day EMA could suggest an attempt by the bulls to establish control. In this scenario, the pair might experience an initial rise to $29,738. A rally towards the overhead resistance at $30,350 could ensue if this obstacle is surmounted.
As the market evolves, Bitcoin’s price dynamics continue to influence and shape the broader landscape of the crypto space. This ever-changing panorama serves as a valuable compass for traders and enthusiasts, guiding them through the intricate web of trends and possibilities.
Read On: Uniswap Price Prediction
Other Top Altcoins Price Analysis!
Shiba Inu (SHIB) has been making a strong recovery, although buyers are encountering resistance near the overhead level at $0.000012. The upsloping 20-day Exponential Moving Average (EMA) and the Relative Strength Index (RSI) nearing the overbought zone suggest bullish control. A potential rally above $0.000012 could lead SHIB/USDT to levels of $0.000014 and even $0.000016. Conversely, if the price dips below $0.000010, a pullback to the 20-day EMA may signal a potential end to the recovery.
Moving to the four-hour chart, the price correction to the 20-day EMA is expected to be defended by bullish support. The pair may attempt to break and maintain levels above the overhead resistance at $0.000011 in such a scenario. However, if the price sustains below the 20-day EMA, it could indicate weakening bullish momentum, potentially driving the pair towards the major support at the 50-day Simple Moving Average (SMA), where robust buying could be witnessed.
Turning to Uniswap (UNI), the pair has rebounded from the 50-day SMA ($5.79) and surpassed the 20-day EMA ($6.09), demonstrating active buying at lower levels. The battle near the 20-day EMA suggests ongoing bearish resistance, potentially leading to intensified selling and a drop to the 50-day SMA if the price remains below the 20-day EMA. Conversely, a rebound from the 20-day EMA could propel UNI/USDT above the immediate resistance at $6.35 and towards $6.70.
The Maker price analysis shows that MKR has been trading above the breakout level of $1,200, indicating the bulls’ attempt to establish support. The gradual upward slope of the 20-day EMA and a positive RSI suggest bullish dominance. Buyers may aim to breach the immediate resistance at $1,284 and challenge the local high at $1,370, potentially initiating a new uptrend. However, bears could trigger a decline below $1,200, potentially leading to a drop to the 50-day SMA.
Additional Read: Shiba Inu Price Prediction
Conclusion
In a market displaying mixed signals, Bitcoin’s stability, altcoins’ diverse performances, and technical indicators provide valuable insights for traders navigating the complex landscape. Monitoring critical support and resistance levels will remain crucial for making informed decisions in this dynamic crypto environment!
Related posts

Bitcoin Price Hits New All-Time High Following Fed’s 25-Basis-Point Rate Cut
Fed’s interest rate cut spurs crypto momentum, boosting Bitcoin and Ethereum prices.

Blum Secures Major Investment from TOP to Strengthen DeFi Presence in TON Ecosystem
TOP’s backing aims to accelerate Blum’s multi-blockchain expansion.