
Key Takeaways:
- Bullish Patterns Indicate Breakout Potential: Bitcoin price shows signs of a breakout with bullish patterns in its RSI and tightening Bollinger Bands, suggesting increased volatility and potential for significant price movements.
- Strategic Trading Opportunities: Traders should look for a breakout above the upper Bollinger Band with increased volume for confirmation of trend strength and set stop-loss orders just below recent lows for protection.
- Support and Resistance Levels: Recent Bitcoin price action highlights short-term support around 63,900 and resistance near 64,000, which are crucial levels for traders to monitor.
- Double-Bottom Formation Signals Bullish Reversal: Multiple double-bottom formations in the recent charts indicate that selling pressure may be exhausting, pointing to a potential bullish reversal and upward price movement.
- Volatility Preparedness: With expected spikes in volatility, both bullish and bearish traders should use tight stop losses and have clear profit targets to manage rapid price changes effectively.
Bitcoin, the pioneering crypto, is showing strong signs of a potential breakout, suggesting that new all-time highs might be on the horizon. Recent market movements, key technical indicators, and trading patterns all point to a significant surge in Bitcoin price, making it a crucial time for traders and investors to pay close attention.
Additional Read: Bitcoin Price Prediction
Bullish Indicators in Play for Bitcoin Price
Bitcoin price movements have been closely watched by traders and analysts, and the recent bullish patterns observed in the RSI (Relative Strength Index) are particularly noteworthy. The RSI, a momentum oscillator that measures the speed and change of price movements, is showing bullish divergence. This occurs when the RSI fails to reach new lows while the price tests lower levels, indicating a potential accumulation of bullish momentum.
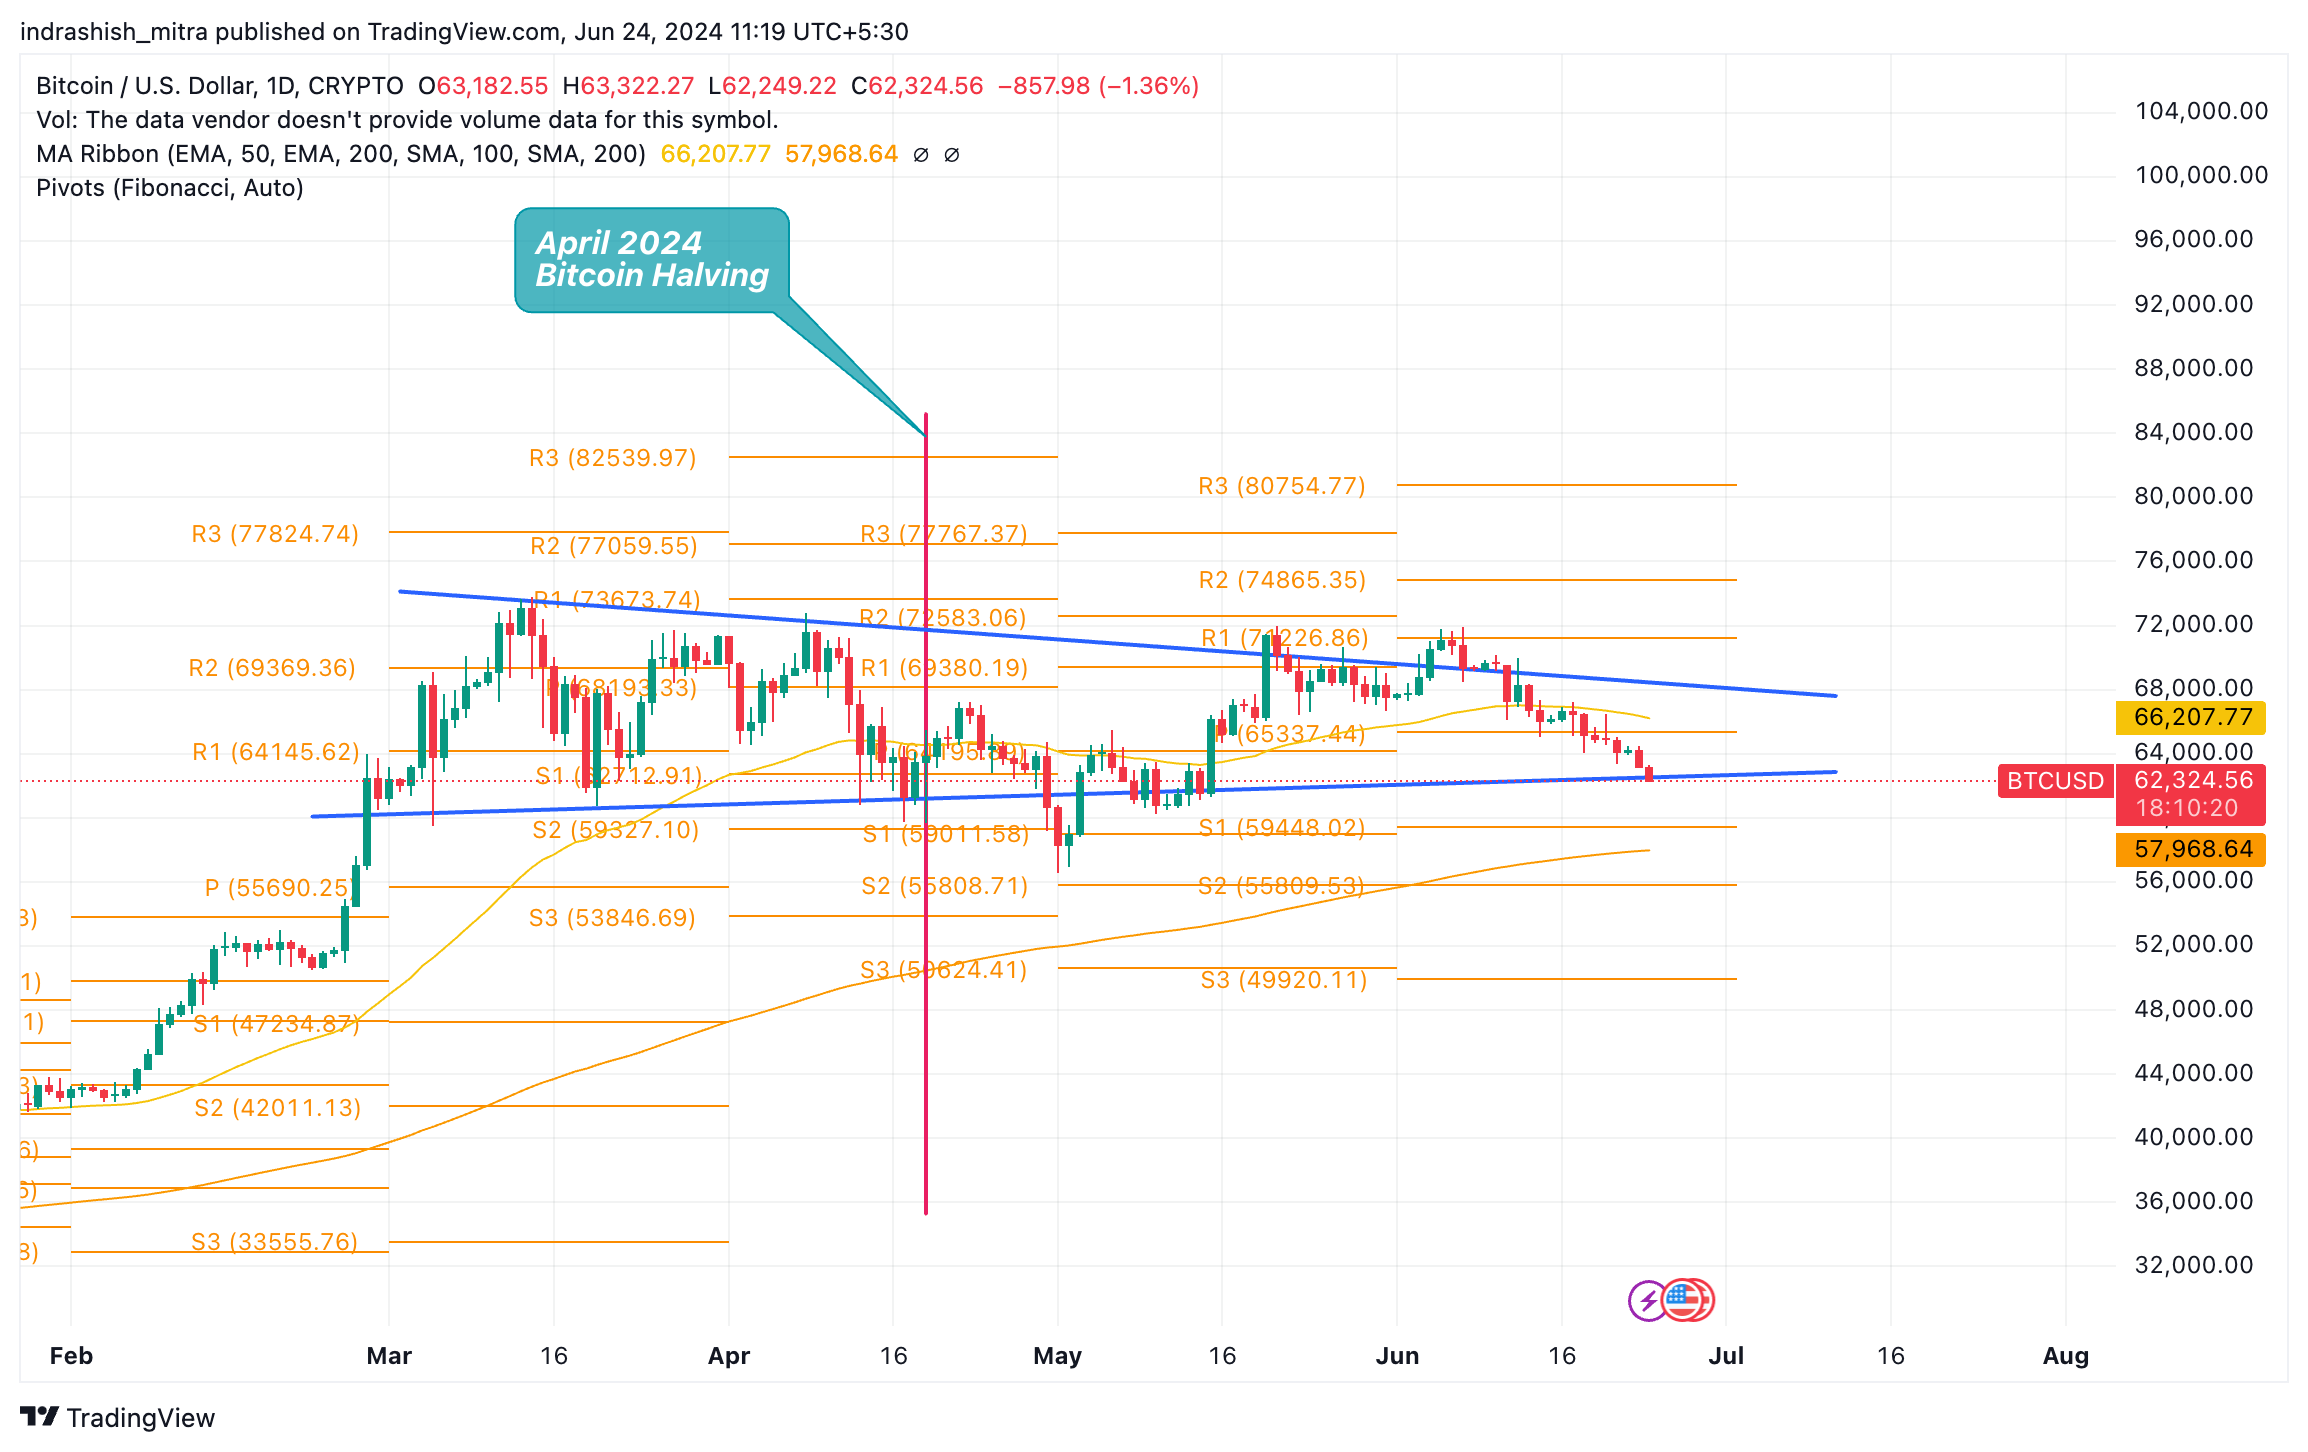
BTC/USD | Source: TradingView
In addition to the RSI, the tightening of Bollinger Bands suggests an impending spike in volatility. Bollinger Bands are a widely used technical analysis tool that depicts price volatility over time. When these bands tighten, it usually indicates a period of low volatility that is often followed by a significant price movement. Historically, such tightening precedes major price shifts, either up or down.
Bitcoin Price: Key Support and Resistance Levels
Examining recent Bitcoin price action, the horizontal lines at the bottom (around $62,000) and top (around $64,000) highlight short-term support and resistance levels. These levels are critical as they can serve as benchmarks for potential breakouts or breakdowns.
The chart also identifies multiple double-bottom formations, a classic bullish reversal pattern. These formations typically suggest that selling pressure is exhausting and an upward move is likely to follow. One notable double bottom near the “Double Bottom RR – 21.5” signifies a high risk-reward ratio, enhancing the likelihood of a bullish reversal.
Trading Strategies for Different Scenarios
Given the presence of both bullish and bearish patterns, traders might consider strategies that accommodate rapid price shifts. Bracket orders, which allow for both upward and downward movements, can be particularly effective in such volatile conditions.
- For Bullish Traders: Monitor for a stable breakout above the recent double-top formation in Bitcoin price. This could signal a significant bullish move, especially if supported by increased volume, a bullish crossover in the MACD (Moving Average Convergence Divergence), or a high RSI reading. Ensuring these indicators align can provide a strong confirmation of the upward trend.
- For Bearish Traders: Look for rejections at key resistance levels and confirmations of double top patterns as opportunities to enter short positions. Setting stop-loss orders above recent highs can help mitigate risks associated with sudden price spikes.
The tightening Bollinger Bands highlight an anticipated increase in volatility, underscoring the need for traders to be prepared for rapid price changes. Both bullish and bearish traders should implement tight stop-loss orders and have clear profit targets to manage potential sudden movements in Bitcoin price.
Conclusion
Bitcoin’s recent market activity, coupled with key technical indicators, suggests that the crypto could be gearing up for a substantial surge. The bullish patterns in the RSI and the tightening Bollinger Bands are particularly promising, indicating that a breakout might be imminent. Traders should remain vigilant, watching for a breakout above the upper Bollinger Band with increased volume as confirmation of trend strength. Additionally, setting stop-loss orders just below recent lows can provide protection against potential downturns.
As Bitcoin’s weekly close approaches, the potential for new all-time highs becomes increasingly plausible. Whether you are a bullish or bearish trader, understanding and leveraging these technical indicators can significantly enhance your trading strategy and help you navigate the exciting yet volatile world of crypto trading.
Source: Cryptopolitan
Related posts

Bitcoin Price Hits New All-Time High Following Fed’s 25-Basis-Point Rate Cut
Fed’s interest rate cut spurs crypto momentum, boosting Bitcoin and Ethereum prices.

Blum Secures Major Investment from TOP to Strengthen DeFi Presence in TON Ecosystem
TOP’s backing aims to accelerate Blum’s multi-blockchain expansion.