
Key Takeaways:
- Bitcoin encounters multiple obstacles above the $26,200 resistance threshold.
- The price hovers below $26,000 and the crucial 100-hourly Simple Moving Average (SMA).
- A prominent bearish trend line forms, with resistance at approximately $25,800 on the BTC/USD hourly chart.
- Should Bitcoin’s value dip below $25,350, it may incur substantial losses.
Introduction
Bitcoin, the flagship crypto, is caught within a persistent bearish trend, dashing the hopes of traders and investors striving for a significant surge. Its price trajectory, which briefly soared towards the $26,500 mark, underwent an abrupt reversal, culminating in a worrisome descent below the crucial $26,000 threshold. In fact, the digital asset even experienced a sudden dip below $25,650, prompting concerns among market participants.
While there are faint signs of consolidation around the $25,600 level, the potential for upward movement remains notably constricted. Notably, Bitcoin’s price lingers in a state of suspension beneath the 23.6% Fibonacci retracement level, meticulously calculated from the sharp downturn witnessed between the $26,487 zenith and the $25,650 nadir.
Adding to the complexity of the situation, Bitcoin continues to trade below both the psychologically significant $26,000 mark and the pivotal 100-hourly Simple Moving Average (SMA). On the hourly BTC/USD chart, a foreboding bearish trend line has solidified, establishing a formidable barrier in proximity to the $25,800 zone. Further compounding the challenge is the presence of immediate upside resistance around $25,800, followed closely by a substantial impediment situated at $26,050. This level represents the 50% Fibonacci retracement point, computed from the precipitous descent initiated at the $26,487 at the top and culminating at $25,650 at the bottom.
Read More: Bitcoin Price Prediction
Bitcoin Price
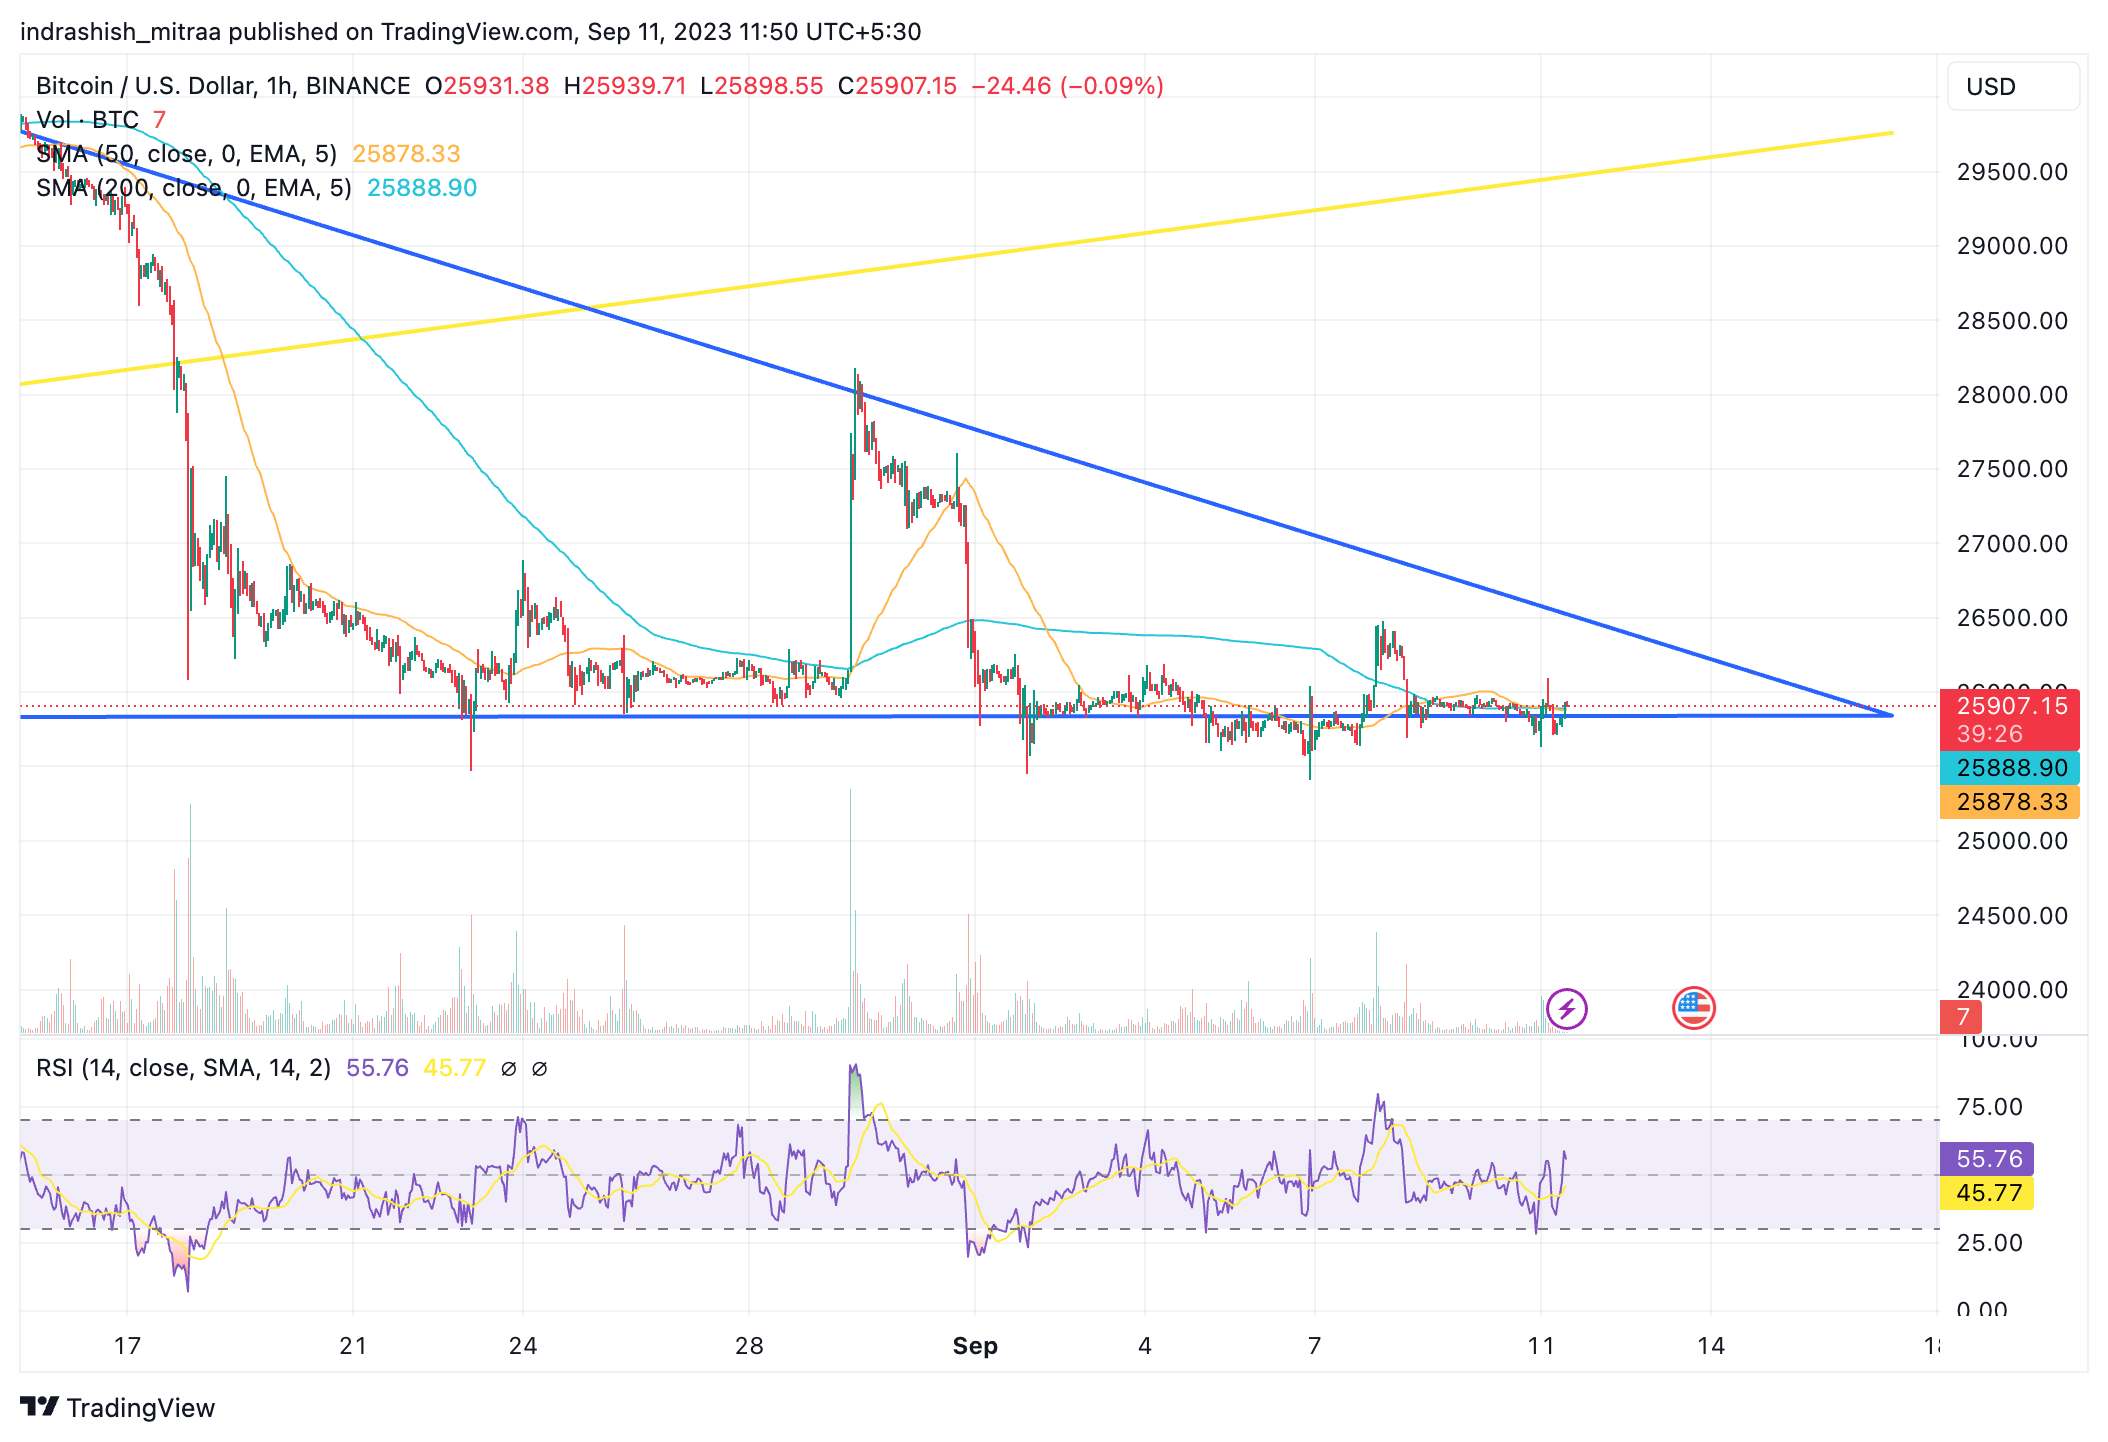
BTC/USD | Source: TradingView
The subsequent noteworthy obstacle emerges around $26,200. A definitive close above this level could potentially spark a meaningful upturn. Beyond that lies a significant resistance level at approximately $26,500, where bullish momentum may gain traction. In such a scenario, the $27,000 threshold could come into play.
More Losses in BTC price?
However, if Bitcoin price fails to surmount the $26,200 resistance, further downward movement is conceivable. Immediate downside support is situated around the $25,600 level. Subsequently, the next major support zone materializes near $25,350. A break below and closure under this level may amplify selling pressure, potentially driving the price toward $24,500 or even $24,000.
Learn More: Bitcoin Technical Analysis
Conclusion
Bitcoin’s price is navigating a challenging landscape, with bearish indicators pointing to potential downside risks. While there are resistance levels to overcome, failure to breach them could lead to further losses. Traders must remain vigilant, closely monitoring key support and resistance levels and critical technical indicators to make informed decisions in the volatile crypto market.
Source: NewsBTC
FAQs
Related posts

Bitcoin Price Hits New All-Time High Following Fed’s 25-Basis-Point Rate Cut
Fed’s interest rate cut spurs crypto momentum, boosting Bitcoin and Ethereum prices.

Blum Secures Major Investment from TOP to Strengthen DeFi Presence in TON Ecosystem
TOP’s backing aims to accelerate Blum’s multi-blockchain expansion.