Key Takeaways
- Bitcoin Cash’s price surged iconically above $140 after rebounding from the lows just above $100, marking a 30% upswing.
- The bulls utilized their accumulated strength to pull the token out of bearish influence but also appeared to be drained, which may hinder the progress of the rally.
- The growing social dominance has paved the way for a rise in active addresses, which is a good sign of a healthy rally
Bitcoin Cash soared high and is currently leading the top gainer’s list with a nearly 23.92% jump in the past 24 hours. The price has recently witnessed a massive downswing after sustaining around $115 to form lows just above $100. This led to a massive shift of focus by the traders away from BCH as its social volume dropped from close to 500 in early June to below 100, a couple of days earlier. Despite this, the BCH price maintained a significant upswing, displaying its strength and independence over market sentiments.
Currently, the price is trading above $132 after undergoing a minor correction from the intraday highs at $141.7. The token has not only entered back into the bullish zone but has also pierced through the upper resistance of the pattern. Bitcoin Cash presently appears to be extremely bullish, but as it faced minor bearish action ahead of testing the yearly highs, it may be speculated that the price may face a notable correction soon.
Bitcoin (BCH) Technical Overview
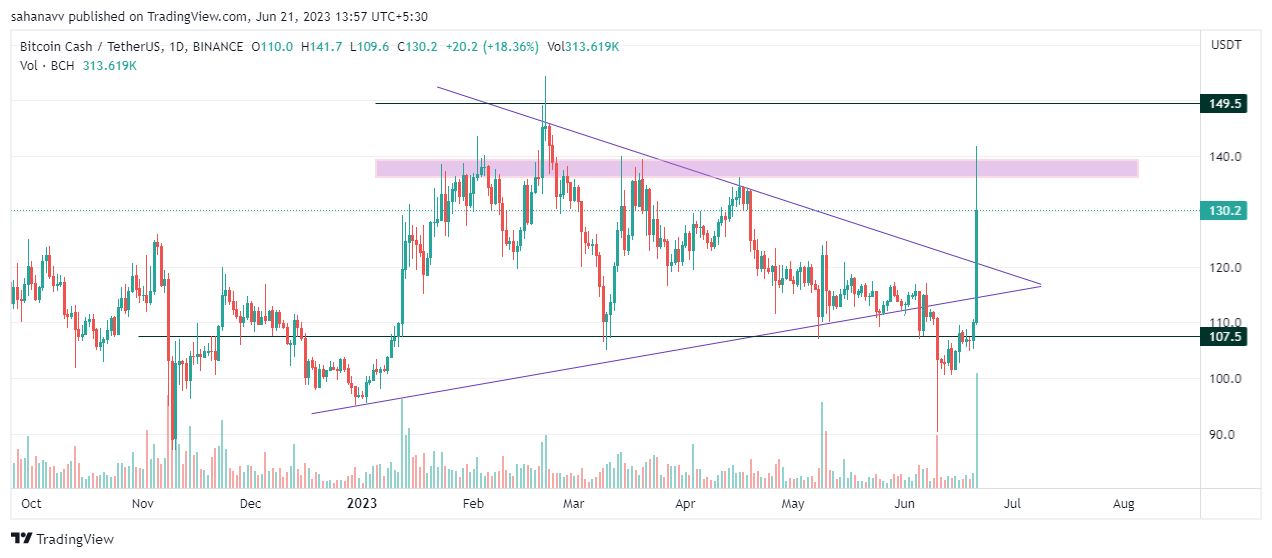
Source: Tradingview
- The BCH price was trading within a symmetrical triangle, while the recent bearish action triggered by the SEC’s crackdown compelled the price to drop below the crucial support
- The price quickly bounced off and has maintained a consolidated upswing, withstanding enormous bullish pressure.
- Presently, the price is experiencing a minor pullback after testing the upper resistance zone between $136.5 and $139.7
- A breakout from the symmetrical triangle is a bullish signal for the token, which suggest a re-test of the upper targets beyond $140 and reaching the yearly highs close to $150
- The RSI is soaring high and may reach overbought levels soon, where a minor retracement is quite possible. However, a bullish reversal currently appears imminent.
Additional Read: Bitcoin Price Prediction
Bitcoin Cash On-Chain Overview
Bitcoin Cash Social Dominance
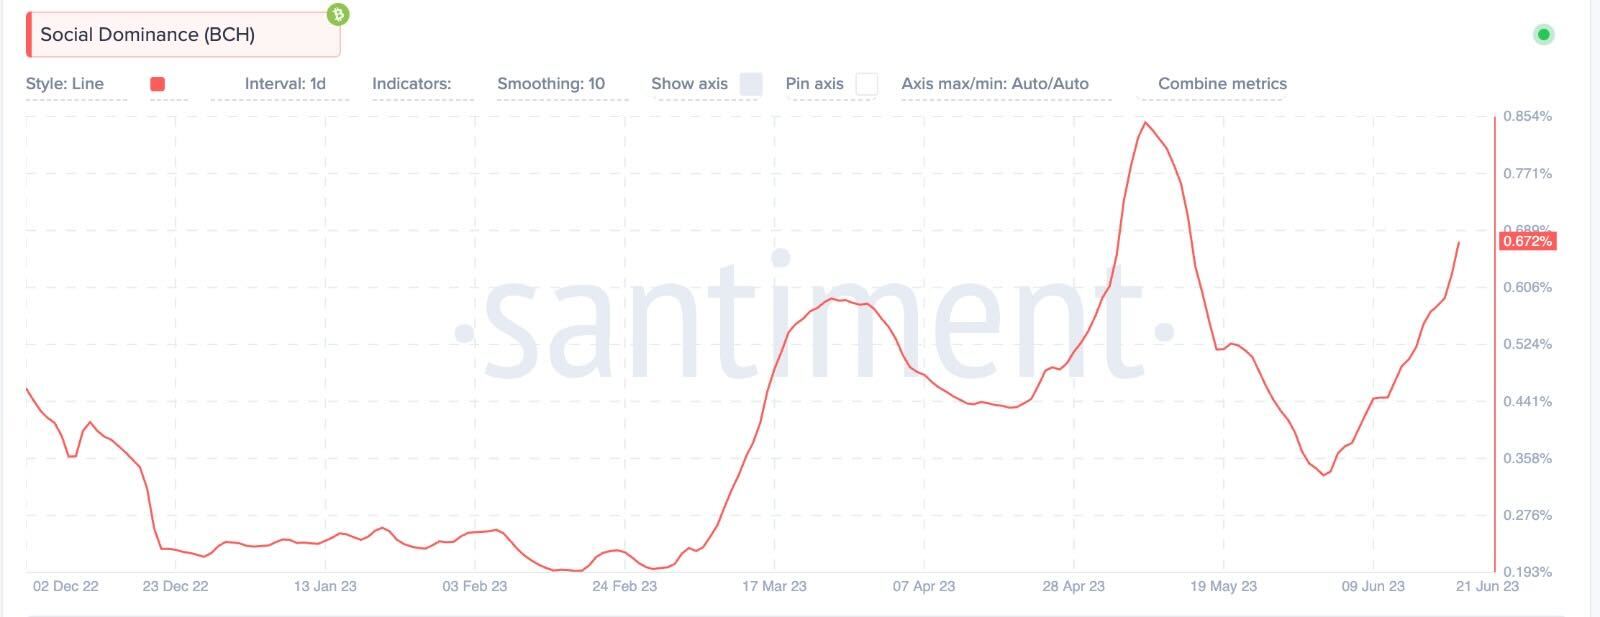
Source: Santiment
The social dominance highlights the share of the discussions within the crypto media regarding the token, considering all the social data. It further compares the social volume of the assets to the combined social volume of the top 100 tokens as per the market cap. If, in this case, the dominance of the token increases by 50%, then it is said that the token’s dominance is half the number of messages or posts that discuss the top 100 tokens.
The social dominance of Bitcoin Cash was pretty high, but it witnessed a major pullback from close to 0.854% to the current levels of 0.672%. However, the levels have increased from the interim bottoms below 0.358%, which suggests the token has just begun to gain user’s attention and a rise in social dominance may eventually have a larger impact on the value of the token in the long run.
Bitcoin Cash MVRV Ratio (Z-score)
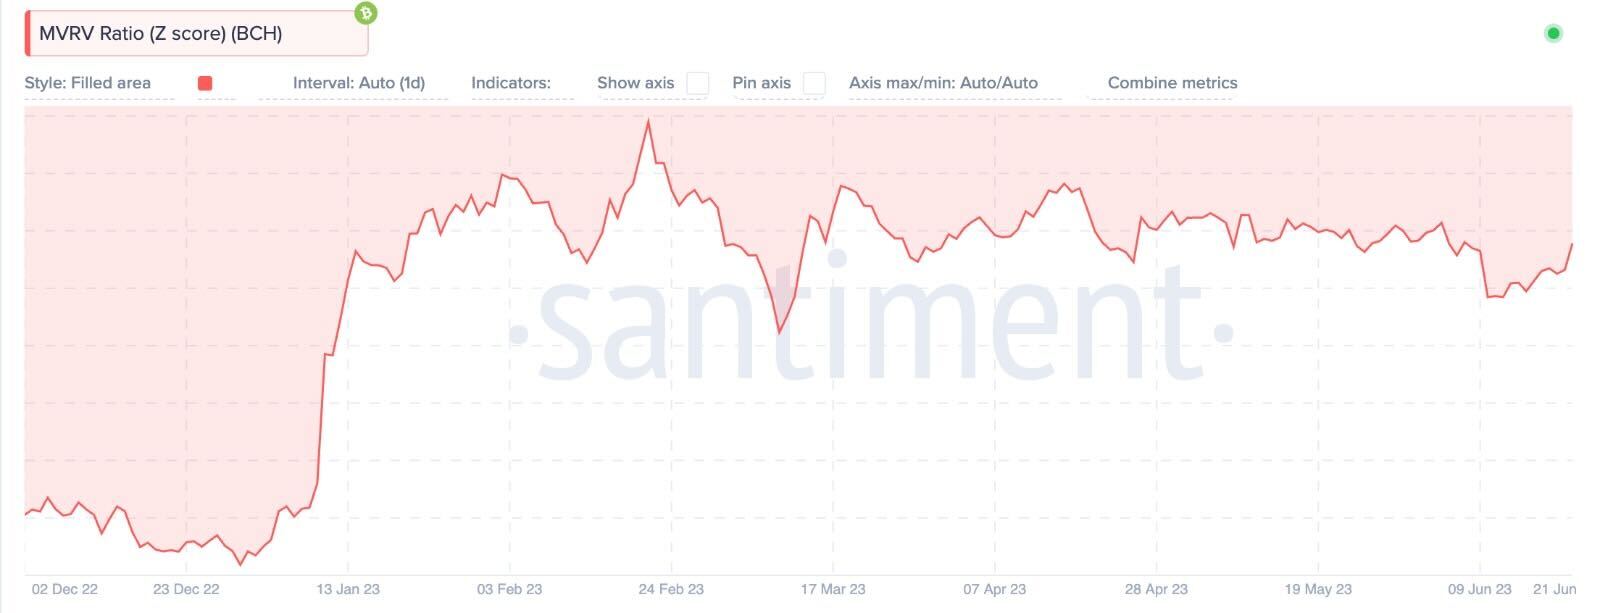
Source: Sentiment
The MVRV ratio is the comparison between the token’s market value to its realized value to get a fair value. In short, it shows the ratio between the current price and the average price of the token. As the ratio increases, it indicates the token is gaining value and hence could be prone for a notable pullback as the investor’s will be willing to sell as the potential profits increase. It gives an idea of how much undervalued or overvalued a token is at the moment.
The MVRV Z-score had maintained its levels between -0.389 and -0.414 for more than a month as the traders neither wished to accumulate nor liquidate. However, the Z score fell heavily in the first week of June to levels around -0.46, indicating the price to be extremely undervalued and hence may attract liquidity. However, the score is rising and currently gained its previous levels, signaling the price is gaining significant value.
Bitcoin Cash Daily Active Address
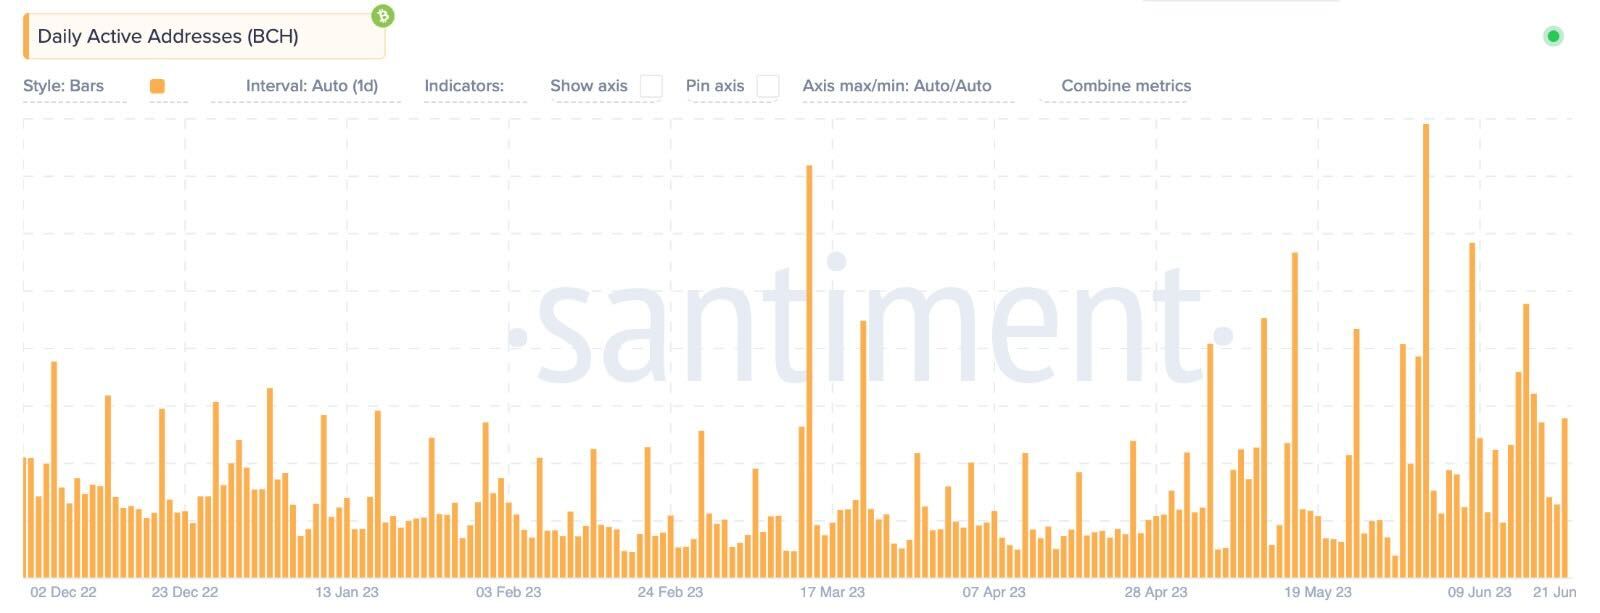
Source: Santiment
A healthy user activity over the platform is extremely important to determine the overall health of the project. A rise in user activity usually triggers the popularity and demand of the platform in the long term. The daily active address is a metric that calculates the level of the user activity over the platform. It considers all the addresses that have interacted with the platform in the past 24 hours, regardless of whether they are a buy, sell, or swap address.
The rise or fall of the DAA levels is closely linked to the value of the token as it highlights user activity on the platform. The DAA levels have been fluctuating very hard since the beginning of May, indicating a rising interest among market participants. The levels reached highs of around 170K addresses in the first week of June and are presently hovering around 68.9K addresses.
Read More: Bitcoin Cash Price Prediction
Concluding Thought
Bitcoin Cash, the hard fork of Bitcoin, has been manifesting acute strength in the past few days, which has attracted investors. The marginal rise in social dominance and the daily and active addresses indicate the growing interest of the investors. Therefore, the BCH price is believed to maintain a healthy upswing in the coming days and mark new yearly highs very soon.
Related posts
Bitcoin Price Hits New All-Time High Following Fed’s 25-Basis-Point Rate Cut
Fed’s interest rate cut spurs crypto momentum, boosting Bitcoin and Ethereum prices.
Blum Secures Major Investment from TOP to Strengthen DeFi Presence in TON Ecosystem
TOP’s backing aims to accelerate Blum’s multi-blockchain expansion.