
Introduction
Welcome, crypto enthusiasts and aspiring traders, to a thrilling journey into the realm of crypto futures trading. In this fast-paced and ever-evolving crypto market, being equipped with the right tools and strategies is crucial to stay ahead of the game. This article will help you equip yourself to wield the power of technical analysis to navigate through the charts and seize lucrative opportunities like a master of the Force.
Technical analysis empowers you to illuminate the hidden patterns and trends within the crypto market. It unveils the secrets of chart patterns, support and resistance levels, and technical indicators, allowing you to make calculated moves and capitalize on the market’s fluctuations.
Whether you’re a newbie in the market, taking your first steps into the world of trading, or a seasoned trader seeking to enhance your skills, this article will serve as a handy guide. We’ll delve into the depths of crypto technical analysis, arming you with the knowledge that can potentially unlock the door to profitability and success.
So, prepare yourself for an enlightening adventure as we explore the galaxy of technical analysis tools, uncovering chart patterns, identifying key levels, and decoding the language of indicators. Together, we’ll unravel the mysteries of the market and equip you with the skills to navigate the crypto futures landscape with confidence and finesse.
Various Technical Analytical Tools You Can Use Today!
In the vast universe of crypto futures trading, technical analysis serves as your trusty toolkit, empowering you to make informed decisions based on market trends and price action. Let’s dive into the arsenal of technical analysis tools available to traders, each offering unique insights into the ever-changing crypto landscape.
- Chart Patterns: Chart patterns are like celestial formations in the crypto market, providing valuable clues about potential price movements. By recognizing these patterns, traders can anticipate trend reversals, continuations, and breakouts. Here are a few prominent chart patterns to watch out for:
-
- Head and Shoulders: This pattern signals a bullish-to-bearish reversal, with three distinct peaks resembling a head and two shoulders. Traders observe the neckline as a crucial level of support, anticipating a bearish downtrend once it is breached.
- Double Top: A double top pattern occurs when an asset’s price reaches two similar peaks, indicating a potential trend reversal. Traders monitor the level of support and anticipate a more permanent reversal against the prevailing trend.
- Cup and Handle: This bullish continuation pattern resembles a cup and handle formation. After a rounded bottom (the cup), a temporary retracement (the handle) occurs before the price continues its upward trajectory.
- Symmetrical Triangle: The symmetrical triangle pattern is a bilateral pattern – which means it can be either bullish or bearish, depending on the market. It is a continuation pattern that forms when the price converges with lower peaks and higher troughs. It suggests that the market will likely continue in the same direction as the prevailing trend.
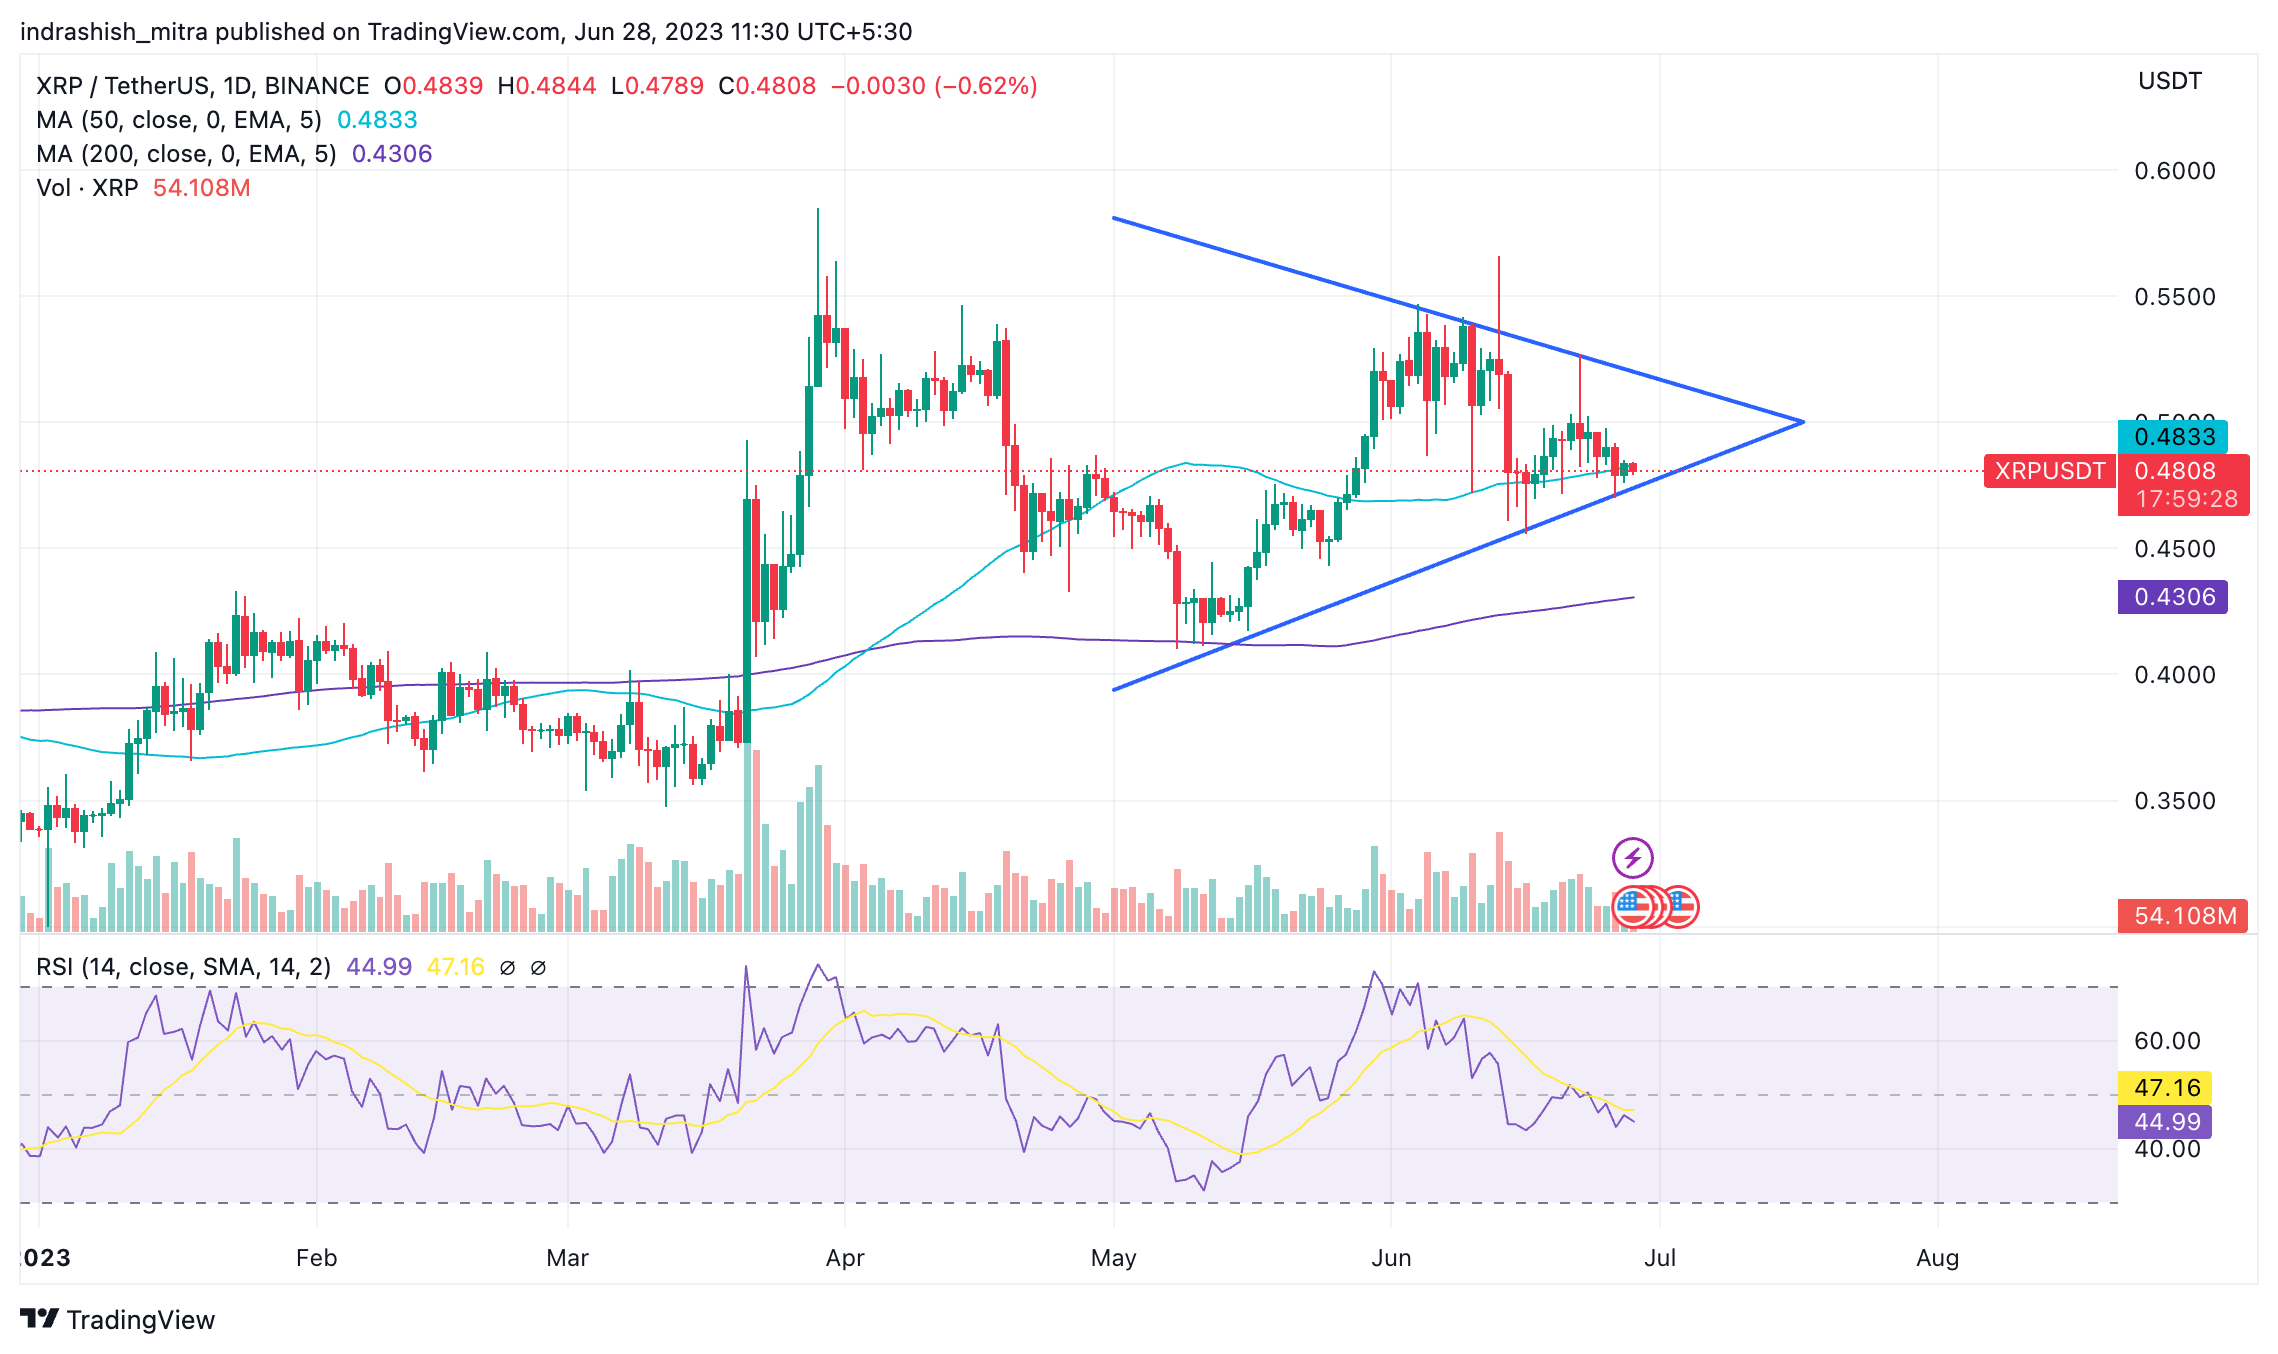
Example Of A Symmetrical Triangle Bilateral Pattern | Source: TradingvView
- Support and Resistance Levels: Support and resistance levels act as the gravitational forces within the crypto market, dictating price movements and potential turning points. Identifying these levels allows traders to make informed decisions. Here’s how they work:
-
- Support Level: A support level is a price point where buying pressure is expected to overcome selling pressure, preventing the price from falling further. It indicates a potential area of demand where traders might enter long positions.
- Resistance Level: On the other hand, a resistance level is a price point where selling pressure is anticipated to overpower buying pressure, preventing the price from rising further. It represents a potential area of supply where traders might consider short positions.
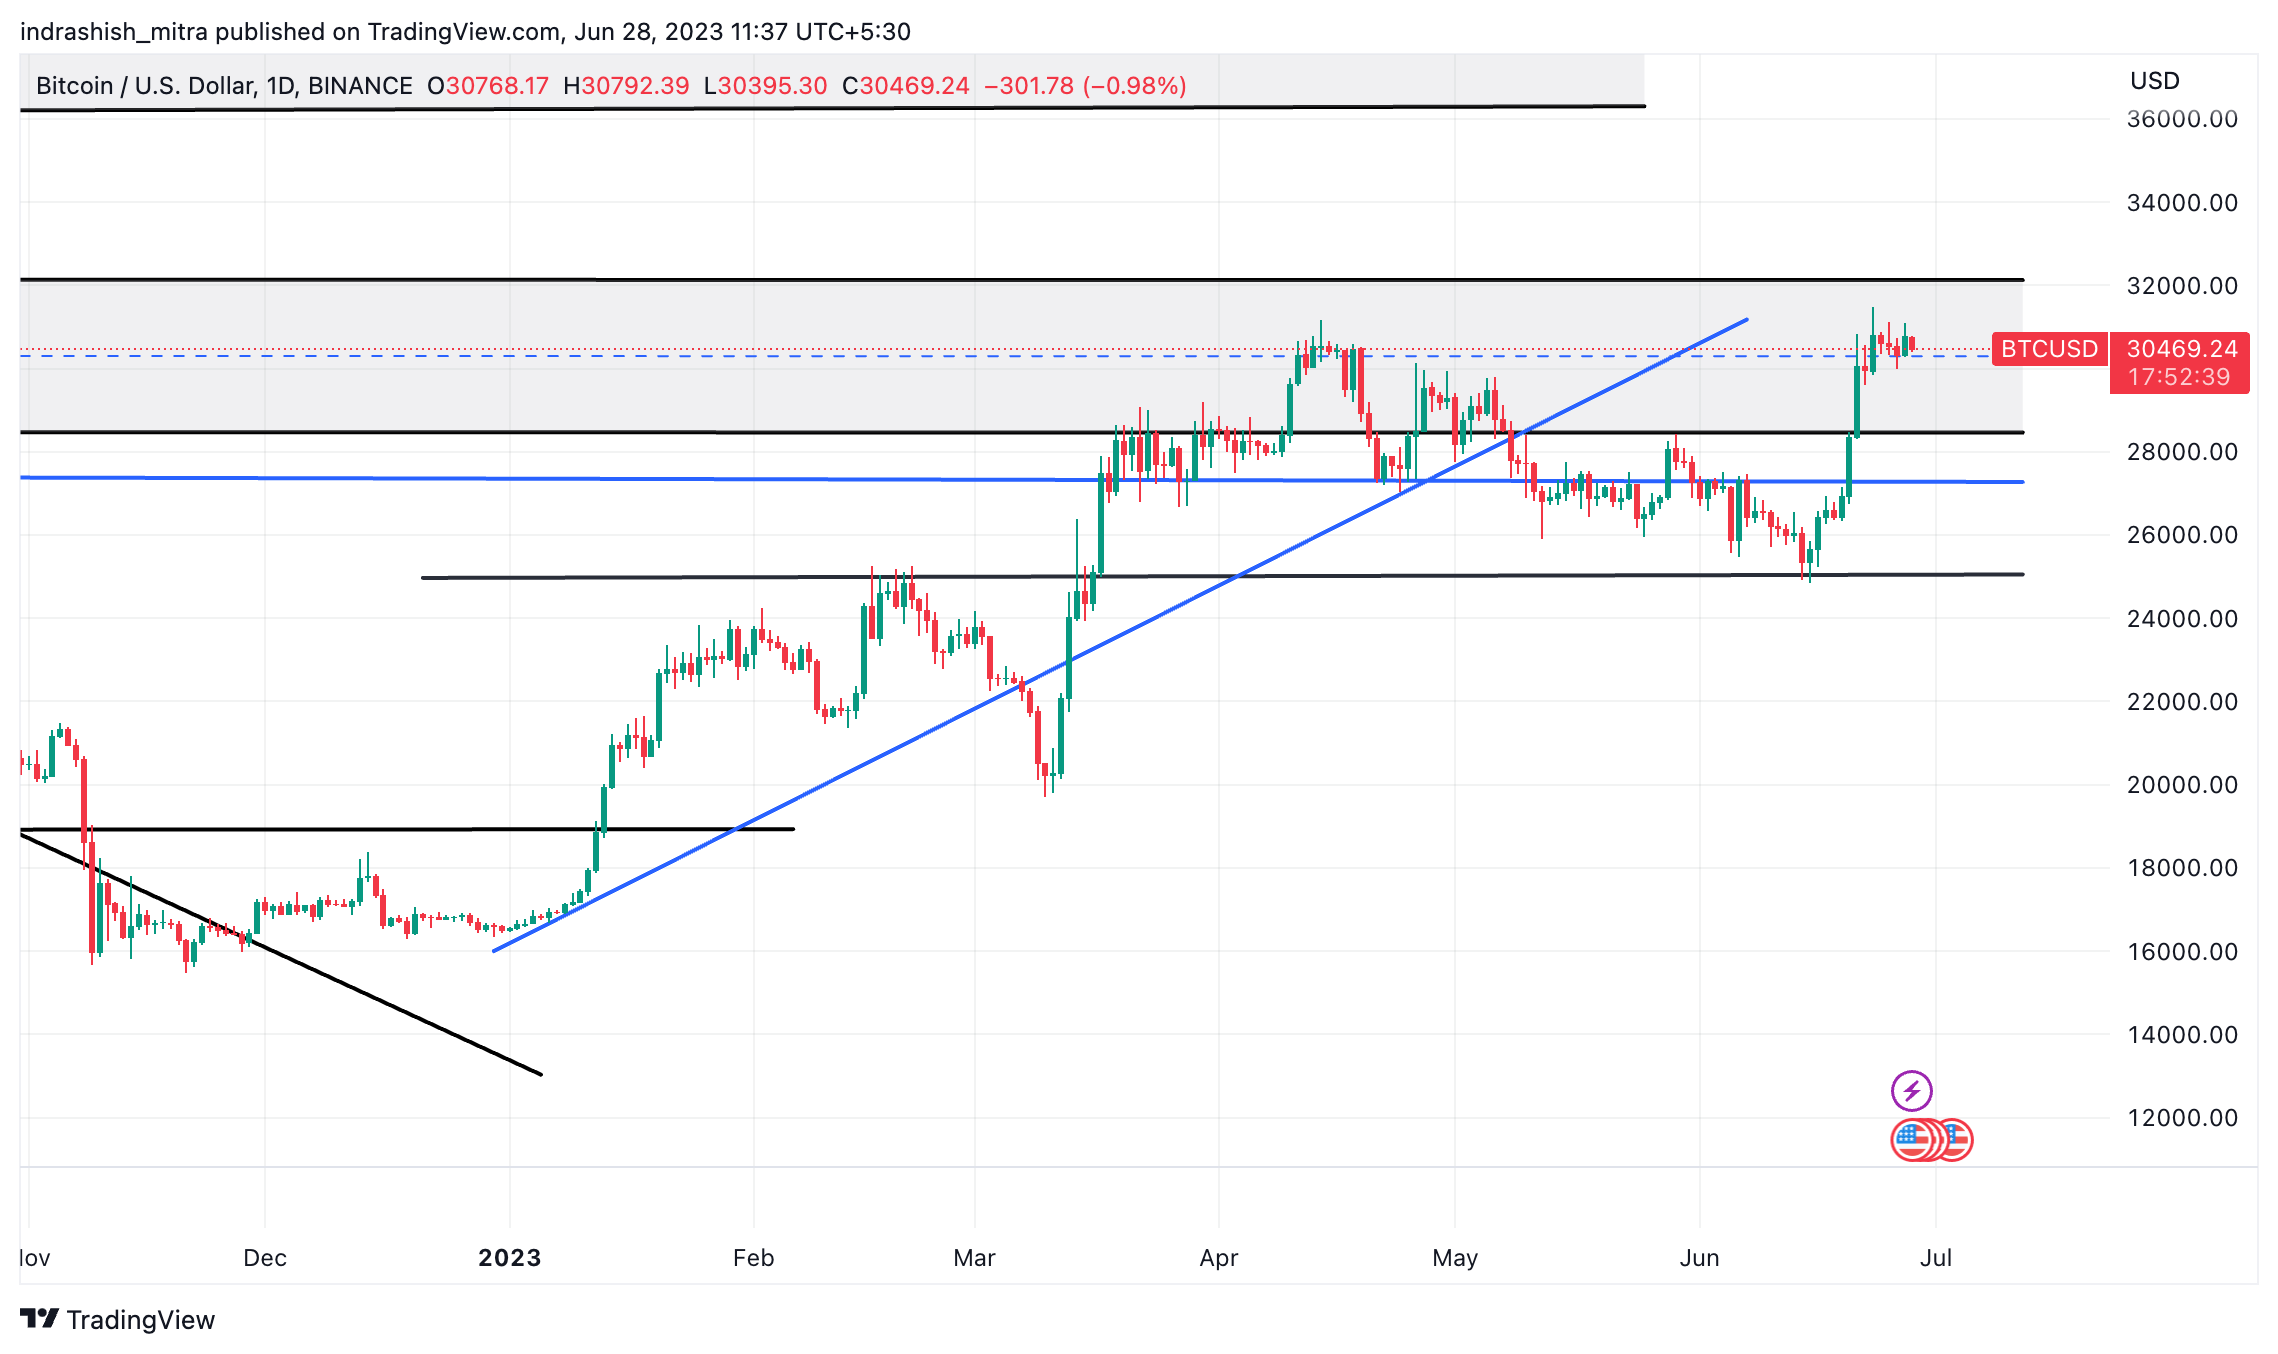
Chart Depicting Various Support & Resistance Levels | Source: TradingView
- Technical Indicators: Technical indicators are like advanced telescopes, helping traders analyze price data and identify potential trends or reversals. These mathematical calculations provide insightful signals that aid decision-making. Here are a couple of widely used technical indicators:
-
- Moving Averages (MA): Moving averages smooth out price data, providing a clearer picture of the overall trend. Traders often use different time periods of MAs, such as the 50-day and 200-day moving averages, to identify potential support and resistance levels.
- Relative Strength Index (RSI): RSI measures the speed and change of price movements. It oscillates between 0 and 100, indicating overbought and oversold conditions. Traders monitor RSI values to identify potential trend reversals or continuations.
- Volumes: Volume indicators measure the number of shares or contracts traded in a given period. By analyzing volume patterns, traders can gauge the strength of price movements and identify potential market trends.
- Moving Average Convergence Divergence (MACD): MACD combines multiple moving averages to provide comprehensive trend information. It consists of a MACD line, signal line, and histogram, helping traders identify potential buy or sell signals.
- Bollinger Bands: Bollinger Bands consist of three lines: the upper band, the middle band (usually a moving average), and lower band. They help traders identify periods of high or low volatility and potential trend reversals.
- Parabolic SAR: Parabolic SAR (Stop and Reverse) helps traders identify potential entry or exit points in a trending market. It appears as dots above or below the price chart, indicating possible trend reversals.
- Supertrend: Supertrend is a trend-following indicator that helps traders identify the current market trend. It consists of a line plotted above or below the price chart, signaling potential buy or sell opportunities.
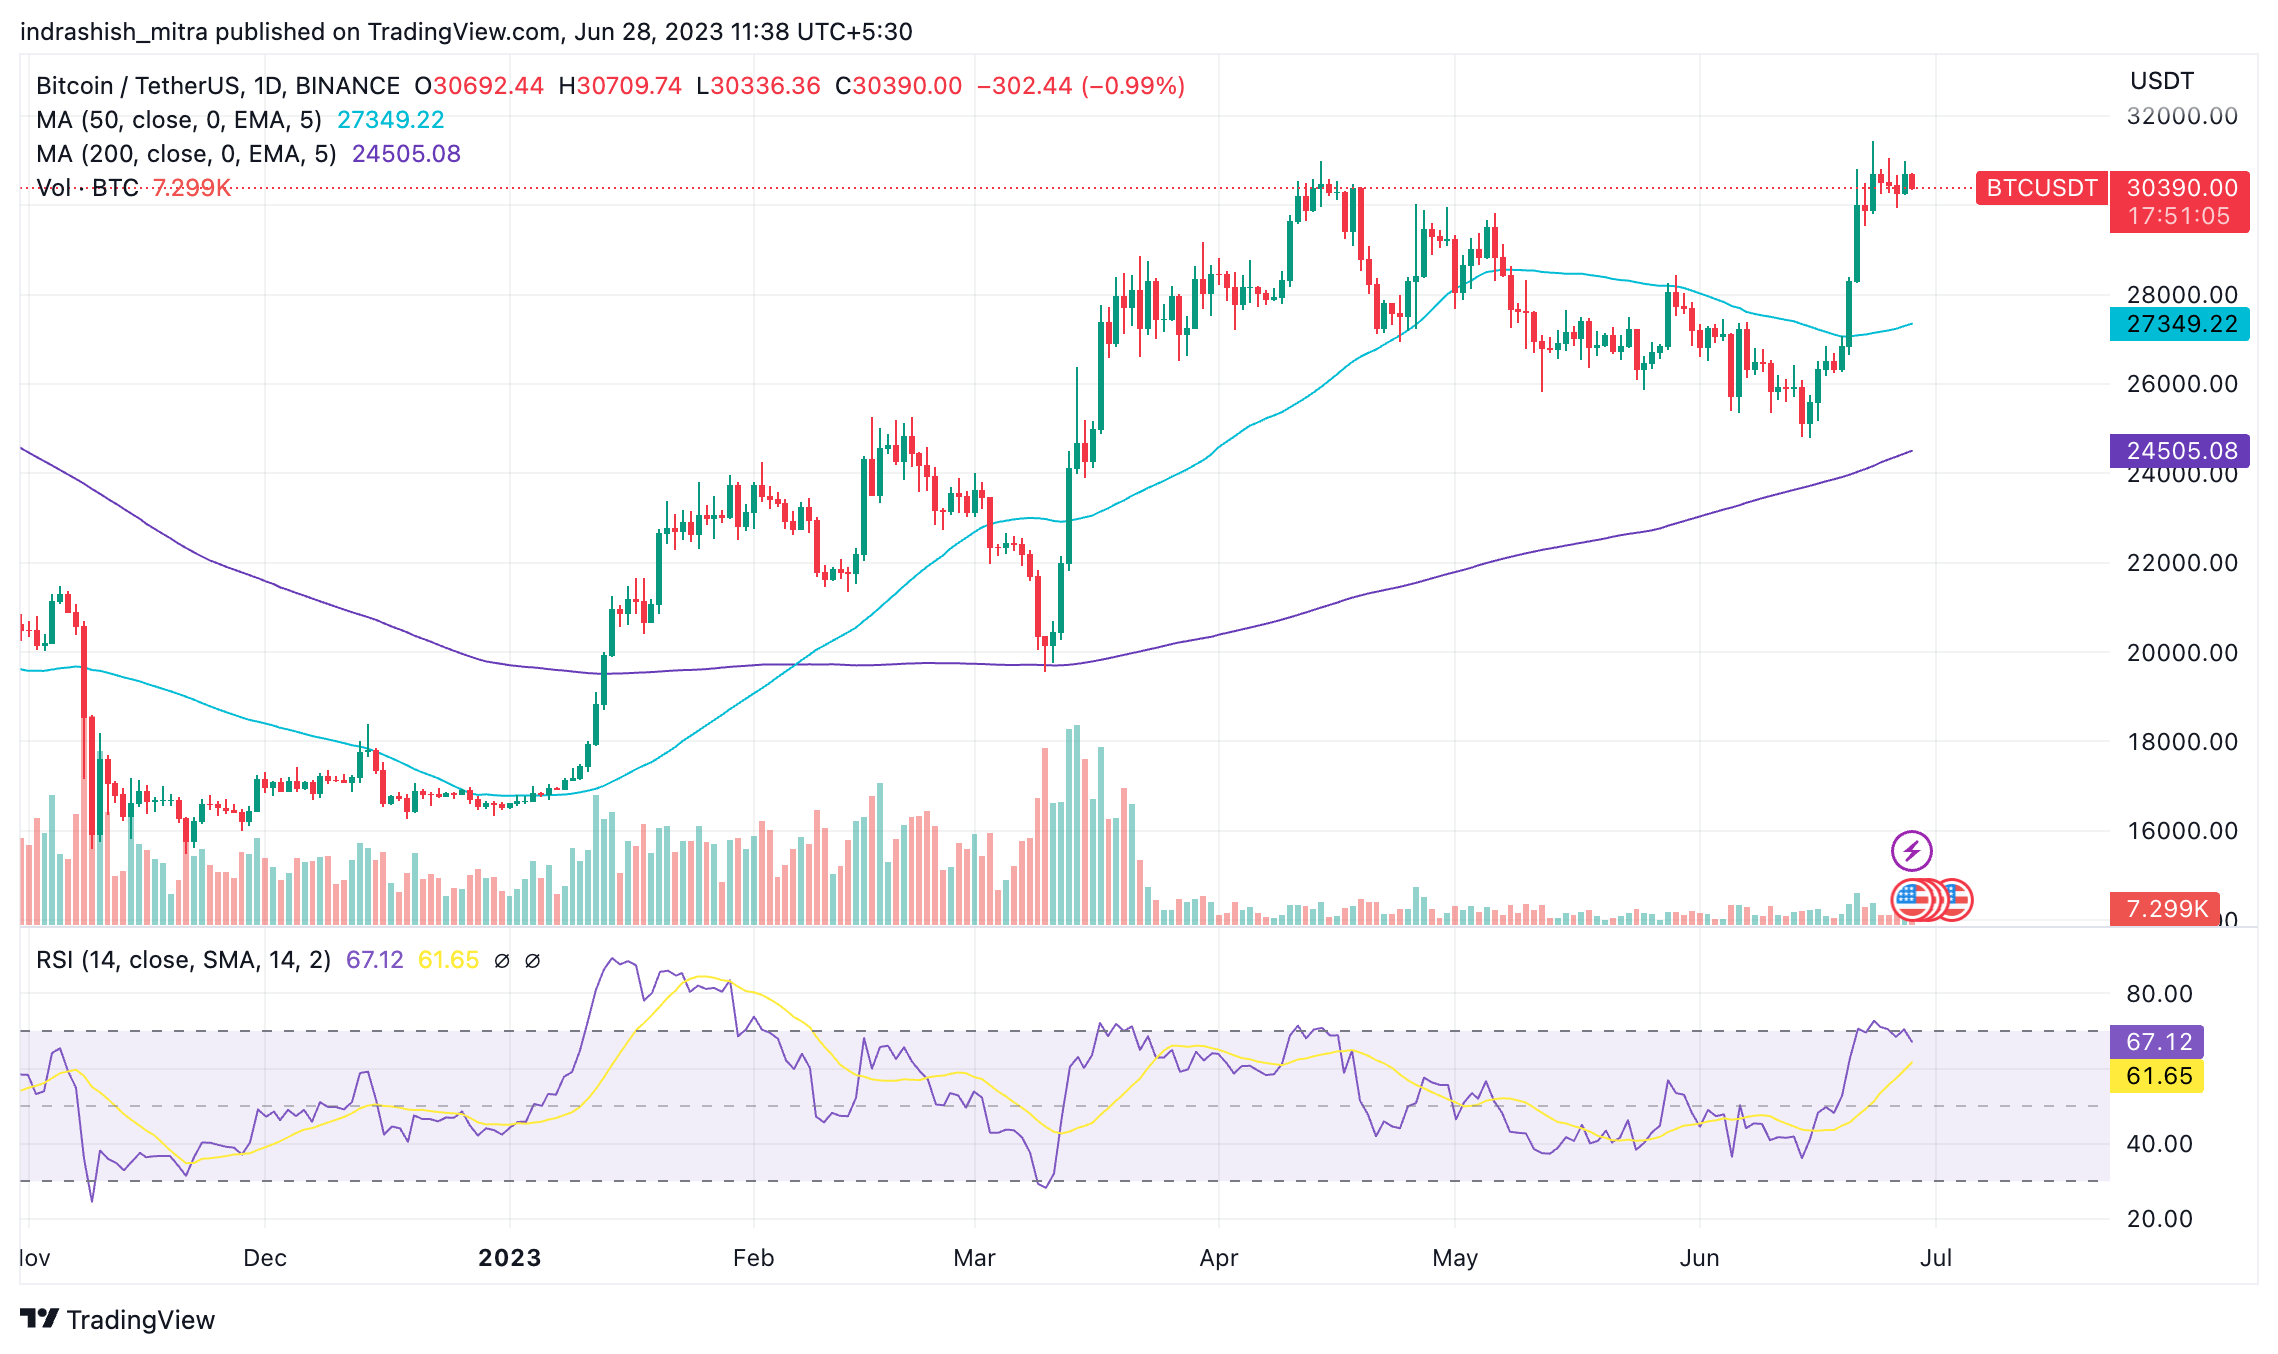
Chart Depicting Some Indicators Like Moving Averages and RSI | Source: TradingView
Note: This is just a small list of some of the most popular technical indicators. There are hundreds more out there, but for the sake of brevity, we have looked at some of the most well known ones.
Try these technical indicators in your next BTCUSDT perpetual futures trade on CoinDCX today!
Remember, these tools are just the tip of the iceberg in the vast cosmos of technical analysis. Additional tools, such as Fibonacci retracements, Bollinger Bands, and stochastic oscillators, offer further insights into market dynamics. As you embark on your journey in crypto futures trading, explore these tools, combine them, and experiment to discover your winning strategy.
Read more: Comprehensive Guide on Bitcoin Futures Trading for Beginners
FAQs
What is technical analysis in crypto trading?
Technical analysis in crypto trading is a method of analyzing historical price data, market trends, and various indicators to make informed trading decisions. It involves studying chart patterns, support and resistance levels, and using technical indicators to predict future price movements. It helps traders identify potential entry and exit points, manage risk, and maximize profitability.
Why is technical analysis important in crypto futures trading?
Technical analysis is crucial in crypto futures trading as it provides traders with valuable insights into market trends, price patterns, and potential price movements. By using technical analysis tools and indicators, traders can make informed decisions, identify entry and exit points, and manage risk effectively. It helps maximize profitability and navigate the volatile nature of the crypto futures market.
Related posts
CoinDCX Launches INR Margin Futures: A New Era for Crypto Futures Trading in India
CoinDCX launches the most cost-effective way to trade futures in India!
Complete Guide to Trading INR Margin Futures on CoinDCX
Trade crypto futures directly with INR on CoinDCX easily.