
Key Takeaways:
- The Ethereum price closed the previous day’s trade at $1287.5 with a market capitalization of $156.31 billion and a circulating supply of 122.7 million.
- Ethereum price continues to hold firm above the crucial support zone hinting towards the revival of a strong bullish surging beyond $1400 soon.
| Current Price | $1323.45 |
| Market Cap | $162.46 |
| Circulating Supply | 122.78 million |
| Supply Inflation Rate | 0.54% |
| Vol (24H) | $19.33 billion |
| Change (7D) | -2.35% |
Technical Analysis for October 2022
The Ethereum price underwent a significant drop soon after the successful transition from PoW to PoS, called the Merge. Since then, prices have been struggling mightily to maintain levels above $1250 as they are unable to penetrate the levels at $1380. Therefore, consolidation is expected until the weekend as the market sentiments do not appear in the favour of the bulls.
The ETH price is currently trading in a decisive phase and will reach the apex during the weekend. A positive movement may take the price beyond $1400, or else a drop may again drag the price close to $1250. However, in that case, the lower support at $1237 may hold the price and ignite a firm rebound quickly.
Therefore, by the end of the month, the ETH price may trade under $1450 and accumulate strength to pull off a massive leg up in the coming months.
Read More: Ethereum Shanghai Upgrade
Technical Analysis at a Glance
Given the current price levels, it would be difficult to imagine that the price of ETH was trading above $3,500 at the start of 2022. However, the token still appears to be poised to regain the lost levels as it continues to trade with a 4-digit figure, withstanding the bearish pressure. Therefore, the volatility may intensify with the advancement towards the end of the yearly trade. Hence, a spike beyond the pivotal resistance may be imminent in the upcoming days.
| Short-Term (4Hrs) | The price of ETH is attempting to maintain a notable upswing, but the lack of volume could slow the rally’s momentum. |
| Mid-Term (Daily) | Despite a dropped volatility the price is utilising all its resources to maintain a decent upswing |
| Long-Term (Weekly) | Given that the buying pressure is waning, the long-term outlook for the ETH price appears to be somewhat bearish. |
Technical Indicators & Pivot Levels
| Indicator | Value (Short Time Frame /High Time Frame)(5Hrs/Weekly) | Action (Short Time Frame /High Time Frame)(5Hrs/Weekly) |
| Relative Strength Index(RSI) | 54.37 /39.40 | Neutral / Sell |
| MACD | -6.0 /-340.17 | Sell / Sell |
| Average Directional Index(ADX) | 30.21/20.33 | Buy /Sell |
| Ultimate Oscillator | 56.73 /50.93 | Buy /Neutral |
| Bull-Bear Power | 60.63 /-452.66 | Buy /Sell |
Pivot Levels
| Moving Average | Short Term | Long Term |
| MA 5 | $1286.81 | $1346.16 |
| MA 10 | $1289.10 | $1511.26 |
| MA 20 | $1290.51 | $1463.07 |
| MA 50 | $1320.35 | $2500.76 |
| MA 100 | $1320.85 | $2376.74 |
| MA 200 | $1428.96 | $1298.56 |
Ethereum price are displaying a huge amount of bullish momentum nowadays, and hence a notable upswing may be imminent in the short-term. While in the long-term the prices exhibit the possibility of falling into a deep bearish well. While the major indicators are bullish in STF, a short-term bounce appears to be imminent raising the price close to $1500.
Conversely, in the long term, the bears are expected to regain the dominance that may compel the price to slash hard. The levels of MACD & Bull-bear power point towards a huge drop in the prices that may end the yearly trade on a bearish note.
Ethereum On Chain Analysis
- The percentage of the ETH on exchanges has been rising consistently indicating that the market for the crypto is active. A high ratio indicates huge liquidity is available for the market participants to either buy or sell.
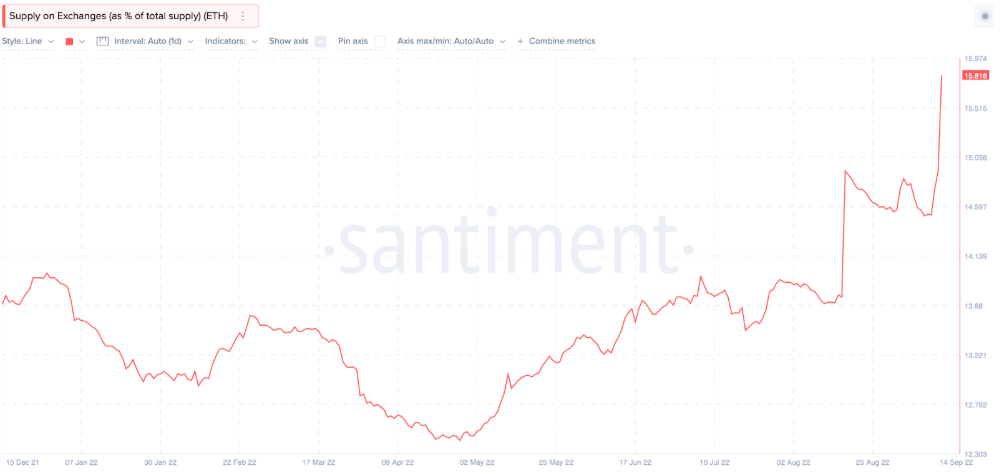
Source : Santiment
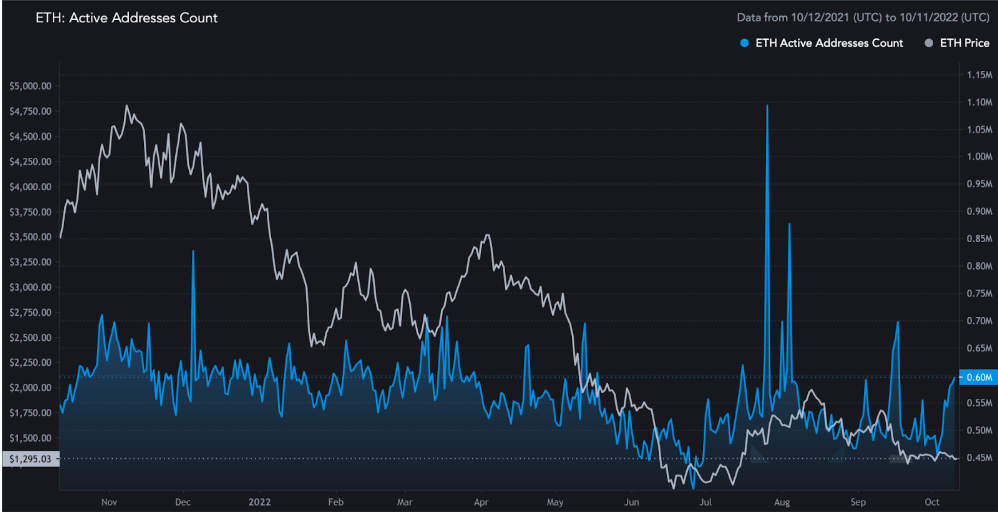
- Active addresses have been raising for the past week after they rebounded firmly from nearly 4.5 million to the current levels of close to 6 million per day
- The development activity over the platform has witnessed a significant drop ever since the Ethereum Merge was accomplished successfully
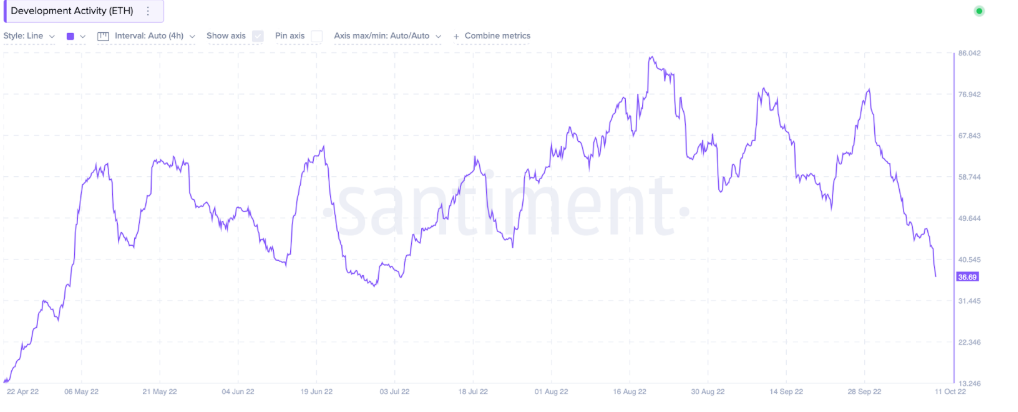
Source: Santiment
- The MVRV ratio or the Market Value to Realized Value, used to determine whether the token is overvalued or undervalued. It has risen within the positive ranges and hence appears to have traded within the overvalued range from the past month signifying the revival of a notable bullish trend
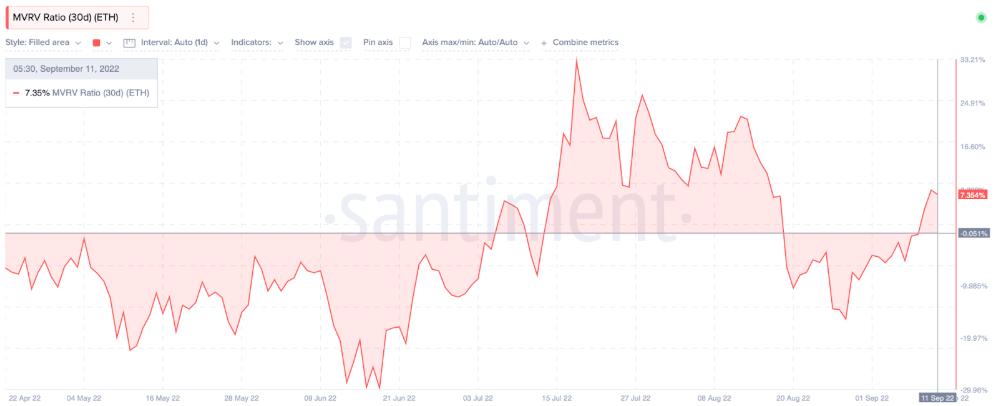
Source: Santiment
Ethereum (ETH) Technical Analysis for Short Term
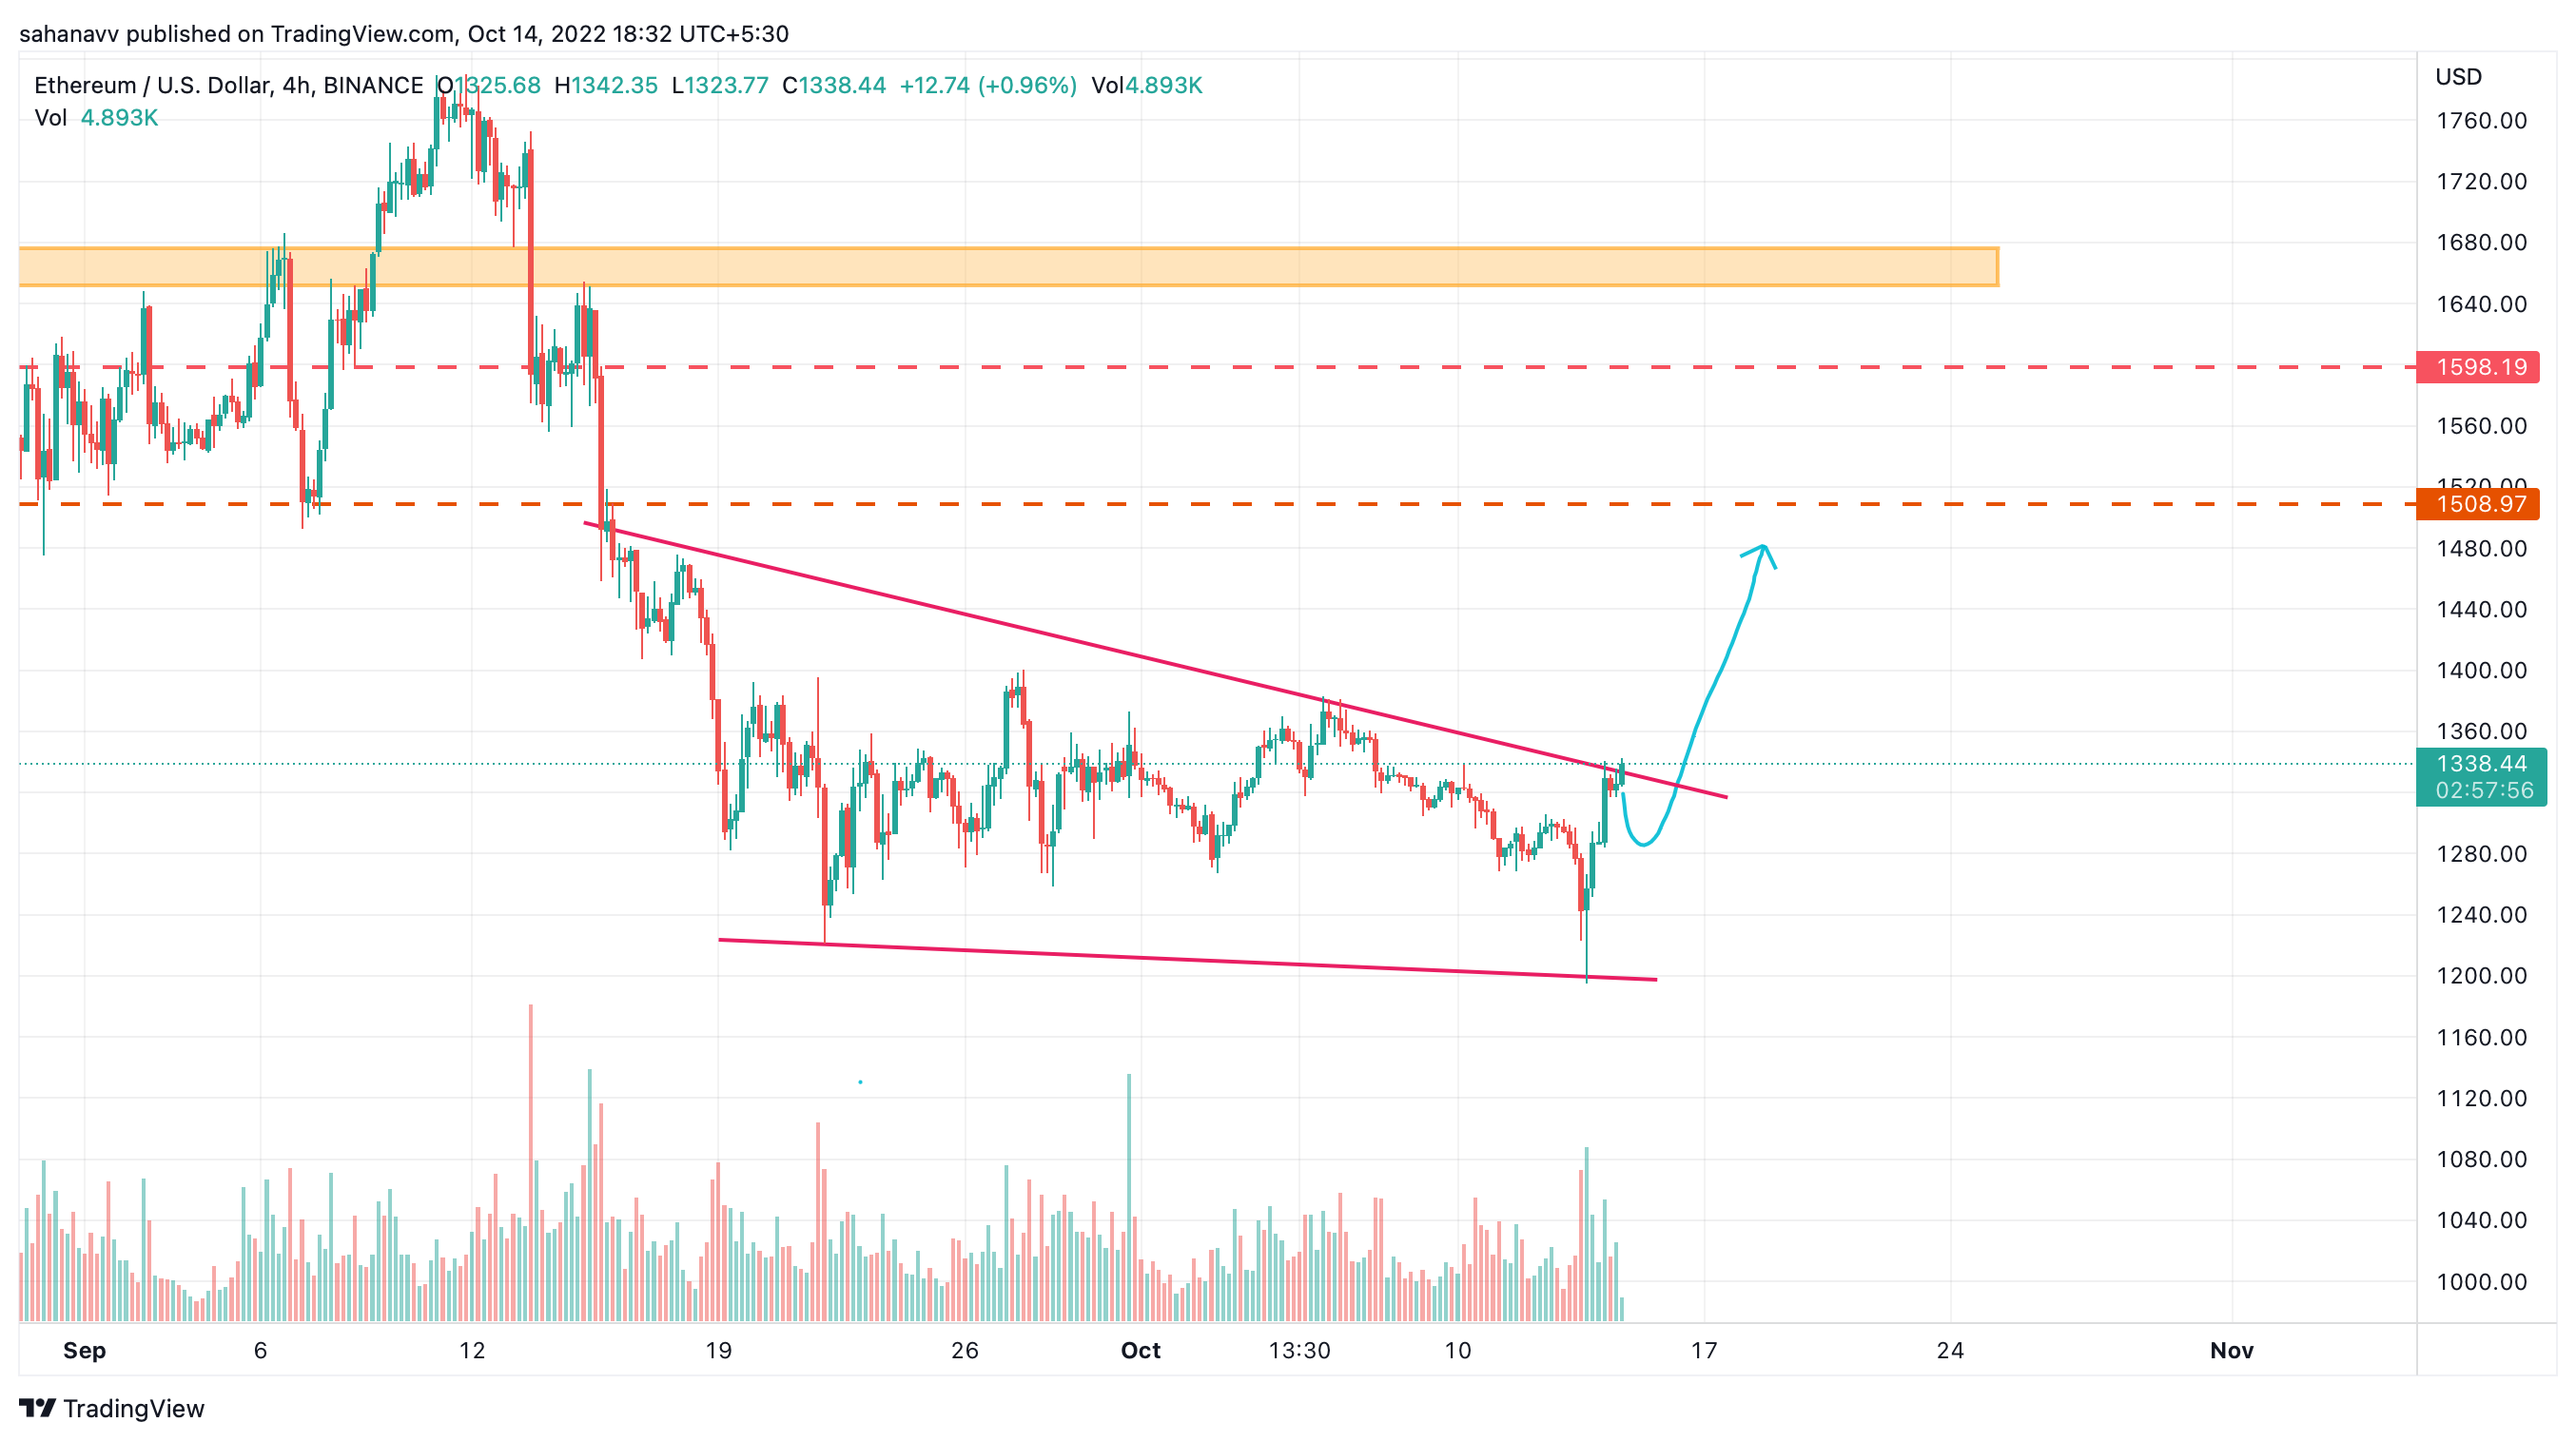
Source: Tradingview
- The ETH price has bounced firmly after testing the lower horizontal support and presently testing the upper resistance
- The token is still consolidating along the resistance, which raises the prospect of a slight pullback in the meantime.
- However, the ETH price is anticipated to rebound and surge back toward the resistance after testing the support again at $1280.
- If the bulls continue to provide the necessary support at this point, then a significant upswing may soon push the price past $1400.
Ethereum (ETH) Technical Analysis for Long-Term
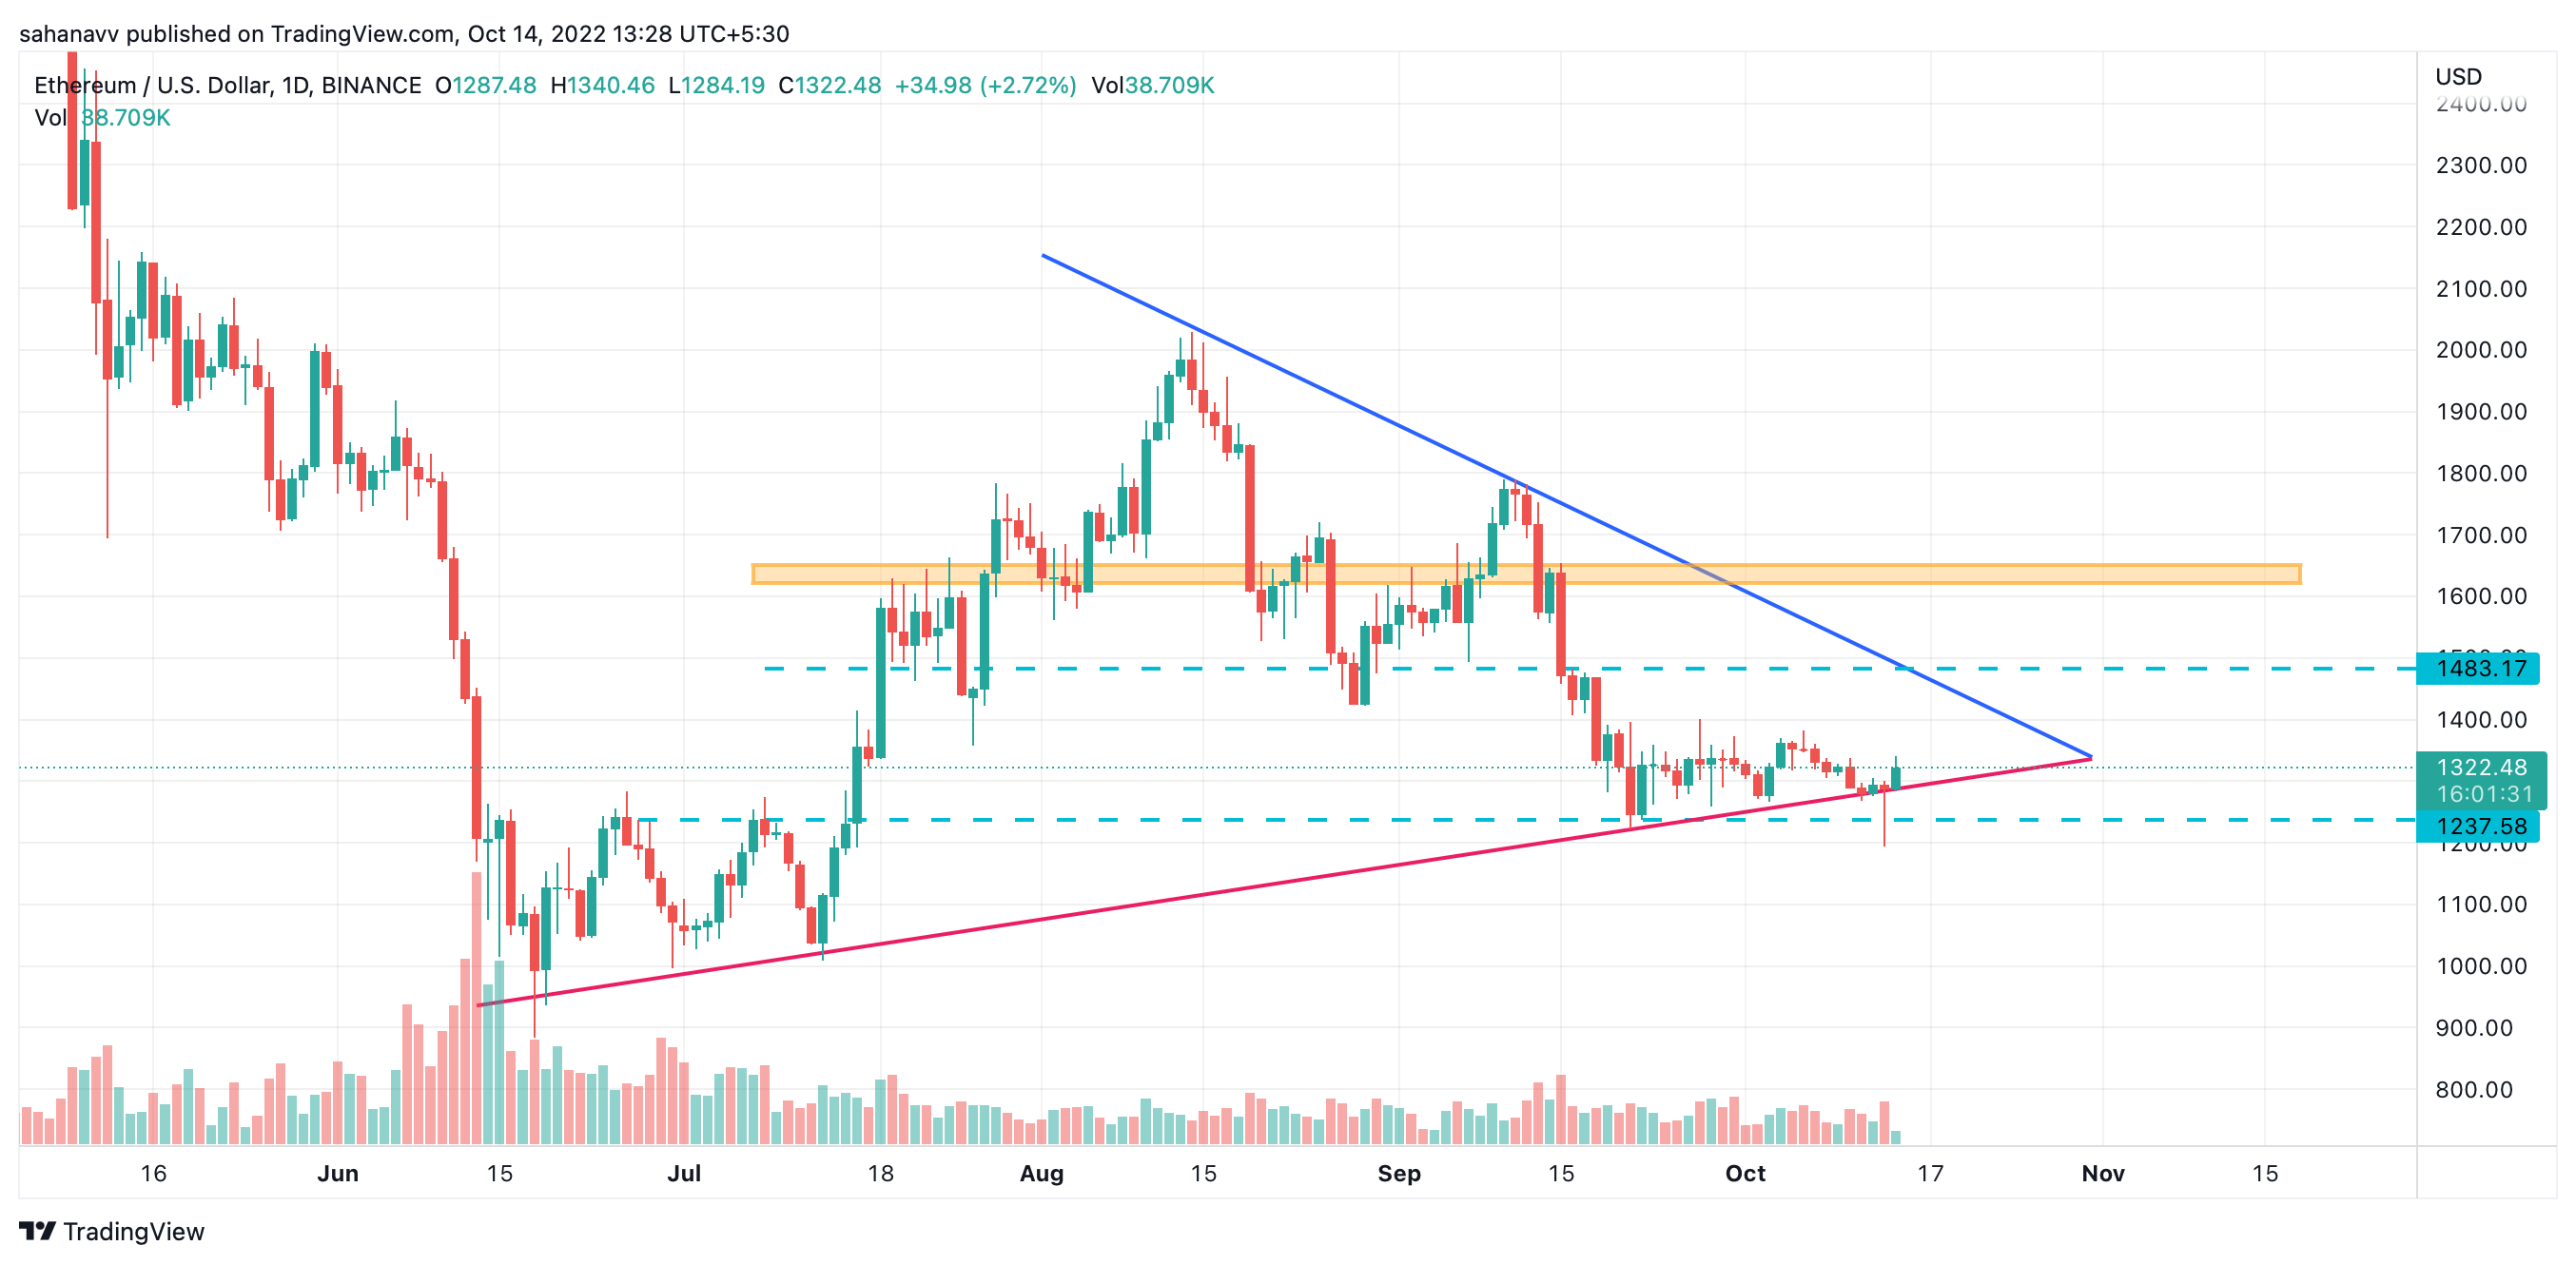
Source: Tradingview
- The Ethereum price is trading within a decisive pennant triangle for more than a month and presently trading along the lower support
- An extended squeeze is mounting huge bearish pressure over the token which is expected to offer a catapult action soon
- With a jump, the ETH price may slice through the triangle and rise beyond the crucial resistance at $1480
- In the event of a pullback, the price may retrace and test the lower support level at $1250 before launching a powerful rebound.
Where & How to Buy Ethereum(ETH)?
If you want to buy the most popular crypto, Ethereum, then download the CoinDCX App on your smartphone. You need to enter the required details and wait for verification. Meanwhile, you can also complete your KYC. Once your profile is verified, transfer funds to the CoinDCX wallet and buy ETH.
FAQs
Related posts

Bitcoin (BTC) Technical Analysis: Balancing Short-Term Caution with Long-Term Optimism
Key Takeaways: Long-Term Strength: Bitcoin price’s longer-term trends, as indicated…

Bitcoin Technical Analysis: BTC Price Feared To Drop Below $27,000 Again!
Key Takeaways: After trading under the bearish influence, Bitcoin price…