Table of Contents
ToggleIntroduction
The forthcoming Bitcoin halving in 2024 is poised to mark a pivotal juncture in the crypto landscape, with profound implications for miners and market participants. As the countdown to this highly anticipated event accelerates, a comprehensive analysis of historical Bitcoin fee patterns emerges as a crucial lens through which to understand the evolving dynamics of the Bitcoin network.
Recent on-chain data sheds light on the intricacies of transaction fees, revealing nuanced trends and potential shifts in miners’ revenue models. Against the backdrop of this imminent halving, exploring the historical trajectory of Bitcoin fees offers invaluable insights into the network’s resilience, adaptability, and future prospects. Join us as we unravel the intricacies of historical Bitcoin fee patterns and their significance in the context of the impending Bitcoin halving in 2024.
Analyzing Historical Bitcoin Fee Trends
Understanding the historical trends in Bitcoin transaction fees provides valuable insights into the network’s economic dynamics, particularly in the lead-up to significant events such as the Bitcoin halving. Recent on-chain data reveals a nuanced picture of fee patterns, offering glimpses into both continuity and change within the network.
Recent Fee Patterns Leading to the Halving:
- Recent data suggests a general downward trend in Bitcoin transaction fees as the 2024 halving approaches. This trend may be attributed to various factors, including fluctuations in network congestion, changes in user behavior, and shifts in market sentiment.
- However, amidst this overall downward trajectory, intermittent spikes in fees have been observed, indicating moments of heightened activity and increased demand for block space. These spikes may coincide with significant market events, such as price rallies or network upgrades, driving up transaction fees temporarily.
Comparison with Previous Years
Contrasting fee data from 2024 with previous years reveals notable variability in average transaction fees. In 2023, for instance, average fees ranged between $1 million to $2 million per day, showcasing a significant increase compared to the preceding year’s $500k average. This variability underscores the dynamic nature of fee dynamics within the Bitcoin network, influenced by a myriad of factors, including network scalability, market volatility, and technological advancements.
Insights from Glassnode Data
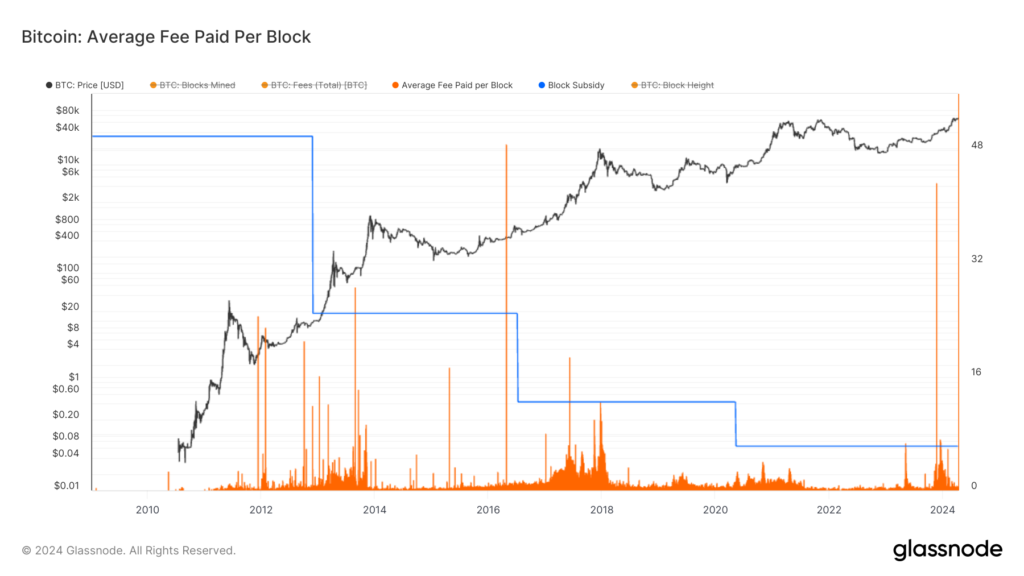
Delving deeper into fee dynamics using data from Glassnode provides granular insights into Bitcoin fee trends over time. The average fee per block, for instance, stands at approximately 0.40 BTC, indicating a recent uptick from 0.10 BTC. This increase may reflect shifts in user behavior, changes in network congestion, or adjustments in fee estimation algorithms by wallet providers and exchanges. Additionally, examining fee trends across different timeframes and market conditions can reveal patterns and correlations that offer valuable insights for miners, investors, and network participants.
Read More: Bitcoin Price Prediction
Historical Fee vs. Block Subsidy Analysis
Glassnode data further highlights the relationship between transaction fees and block subsidies throughout Bitcoin’s history. Instances, where the average fee paid per block exceeded the block subsidy, underscore the importance of transaction fees as a revenue source for miners. This dynamic interplay between fees and subsidies shapes miners’ incentives and revenue streams, influencing their behavior and investment decisions. Understanding these dynamics is crucial for assessing the sustainability of the Bitcoin network’s economic model and its resilience to future challenges.
Implications for the Upcoming Halving: As the Bitcoin halving event approaches, historical fee trends offer valuable insights into potential outcomes and scenarios post-halving. Historical patterns suggest a potential correlation between post-halving price surges and fee resurgence, as miners adjust to reduced block subsidies. With miners facing diminishing block rewards, the reliance on transaction fees becomes increasingly significant, amplifying competition for block space and potentially driving up fees. Anticipating these dynamics and their implications for network security, decentralization, and user experience is essential for stakeholders preparing for the post-halving landscape.
The analysis of historical Bitcoin fee patterns provides valuable insights into the network’s past, present, and future. By examining fee dynamics across different timeframes, market conditions, and network states, stakeholders can gain a deeper understanding of the underlying forces driving fee fluctuations and their implications for the broader ecosystem. Looking ahead, monitoring fee trends and anticipating their impact on miners, investors, and users will be crucial for navigating the evolving landscape of Bitcoin mining economics and network governance.
Learn More: The Phases of Bitcoin Halving
Conclusion
In conclusion, the analysis of historical Bitcoin fee patterns offers valuable insights into the network’s economic dynamics and future prospects, particularly in anticipation of the 2024 halving event. By examining fee trends across different timeframes, market conditions, and network states, stakeholders can gain a deeper understanding of the underlying forces driving fee fluctuations and their implications for the broader ecosystem.
The recent downward trend in Bitcoin transaction fees leading up to the halving underscores the network’s adaptability and resilience amidst changing market conditions. However, intermittent spikes in fees suggest moments of heightened activity and increased demand for block space, reflecting the dynamic nature of the crypto market.
As the halving event approaches, historical fee trends suggest a potential correlation between post-halving price surges and fee resurgence, as miners adjust to reduced block subsidies. With transaction fees becoming increasingly significant as a revenue source for miners, competition for block space is expected to intensify, potentially driving up fees in the post-halving landscape.
Moving forward, monitoring fee dynamics and their implications for miners, investors, and users will be crucial for navigating the evolving landscape of Bitcoin mining economics and network governance. By staying informed and proactive, stakeholders can position themselves to capitalize on opportunities and mitigate risks in an ever-changing crypto ecosystem.
Related posts
Understanding the Different Types of Cryptos: Coins, Tokens, Altcoins & More Explained
Explore the major types of crypto assets and their unique roles.
Read more
PAWS Telegram Game: The New Tap to Earn Game That Is Beating Hamster Kombat
Discover how to play and earn with PAWS Telegram game.
Read more


