
Key Takeaways:
- Bitcoin (BTC): Bitcoin showed signs of recovery in September, faces resistance at $27,400, and has strong support between $25,400 and $25,800.
- Ethereum (ETH): Ethereum remained relatively stable, with challenges at $1,670, a central pivot point at $1,700, and support at $1,580.
- Chainlink (LINK): Chainlink had a 29% year-to-date increase, traded within a range of $6 to $7.5, and rallied in September, targeting $7.8 (R2) and $8.7 (R3).
- Worldcoin (WLD): Worldcoin gained 80% from September lows, broke through moving averages, and targeted $2.14 (R1) with support at $1.
- Pepecoin (PEPE): Pepecoin initially gained but faced a steep decline, now supported at S2 and below the 50-day moving average, with potential for a rally to R1 at $0.00000128.
BTC Price Breaks Down Below $27k Again
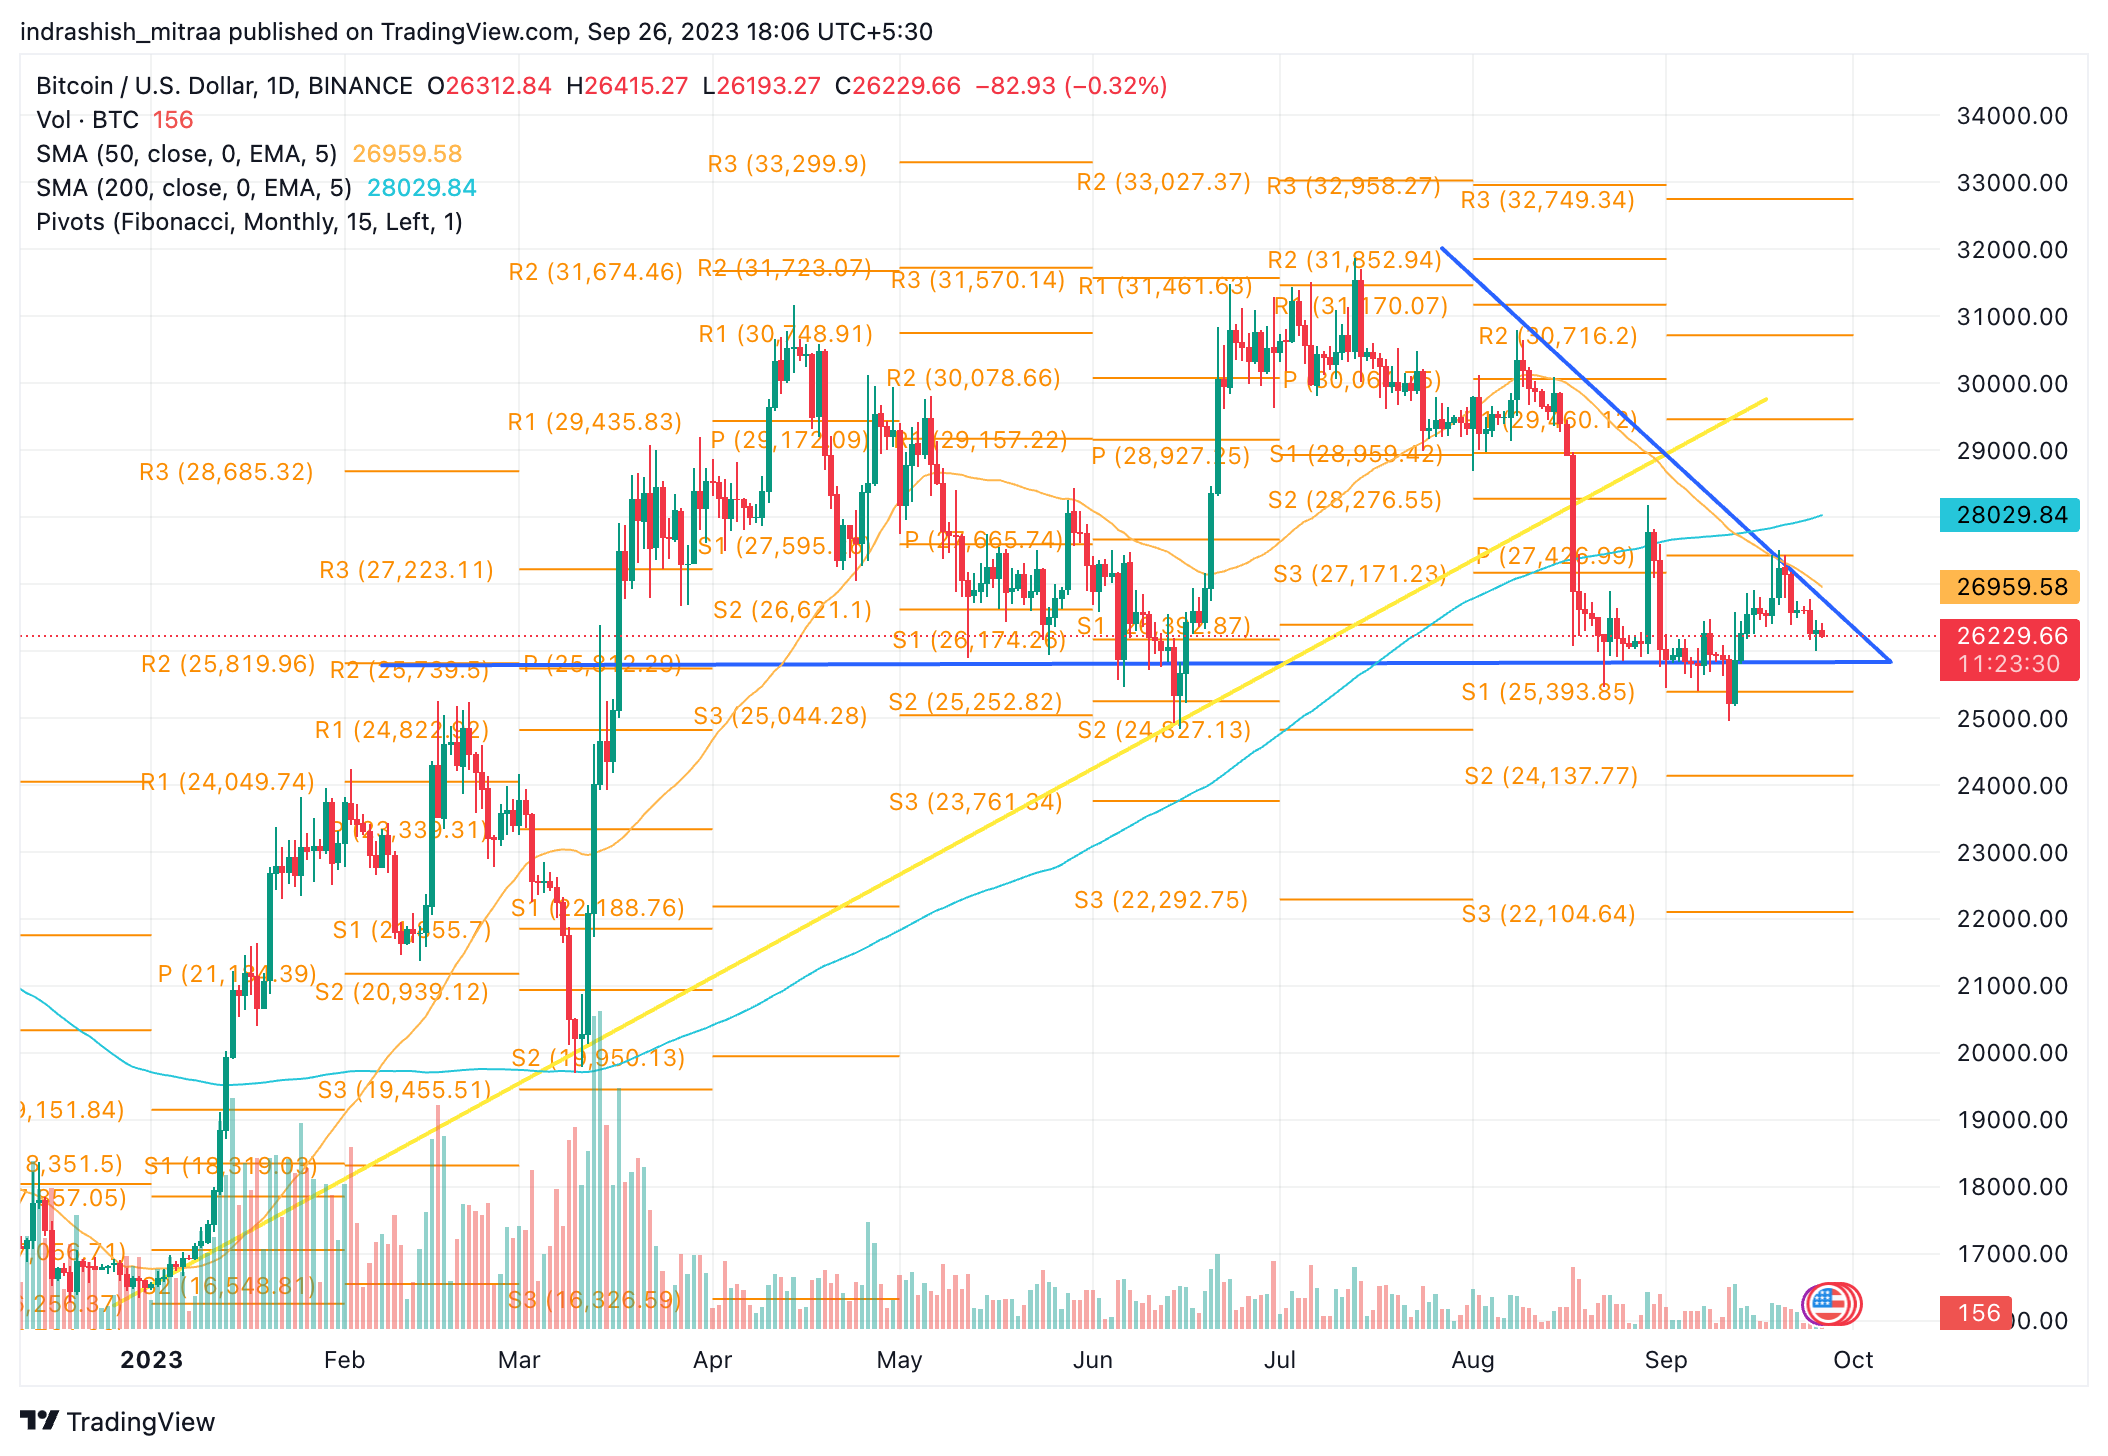
BTC/USD | Source: TradingView
- Bitcoin, the foremost crypto, had a rather unimpressive performance during August 2023. Nonetheless, September has brought some encouraging signs, as Bitcoin rebounded by about 8.5% from its recent low. However, it subsequently dipped below the $27,000 mark two days ago.
- BTC’s price movement indicates a notable development as it strives to break free from the constraints of a descending triangle pattern, clearly depicted by the blue trendlines. It also faces resistance at the critical $27,400 Fibonacci pivot point.
- Conversely, on the downside, the range between the Fibonacci S1 support level at $25,400 and the base of the descending triangle at $25,800 is showing signs of solidifying into a robust support level for Bitcoin’s future price. This level has undergone two tests, first in June and more recently in September, remaining unbreached.
- In light of these observations, there are indications that Bitcoin could generate favorable outcomes under specific circumstances.
- If Bitcoin successfully breaches the resistance at $27,400, it holds the potential to surge toward $29,500, followed by $30,700, as delineated by the Fibonacci pivot lines.
- Conversely, the range spanning $25,400 to $25,800 is likely to function as a dependable support zone in the coming days, providing a safety net for Bitcoin’s price.
Read More: Bitcoin Price Prediction
ETH Price Falls Below $1600 Yet Again!
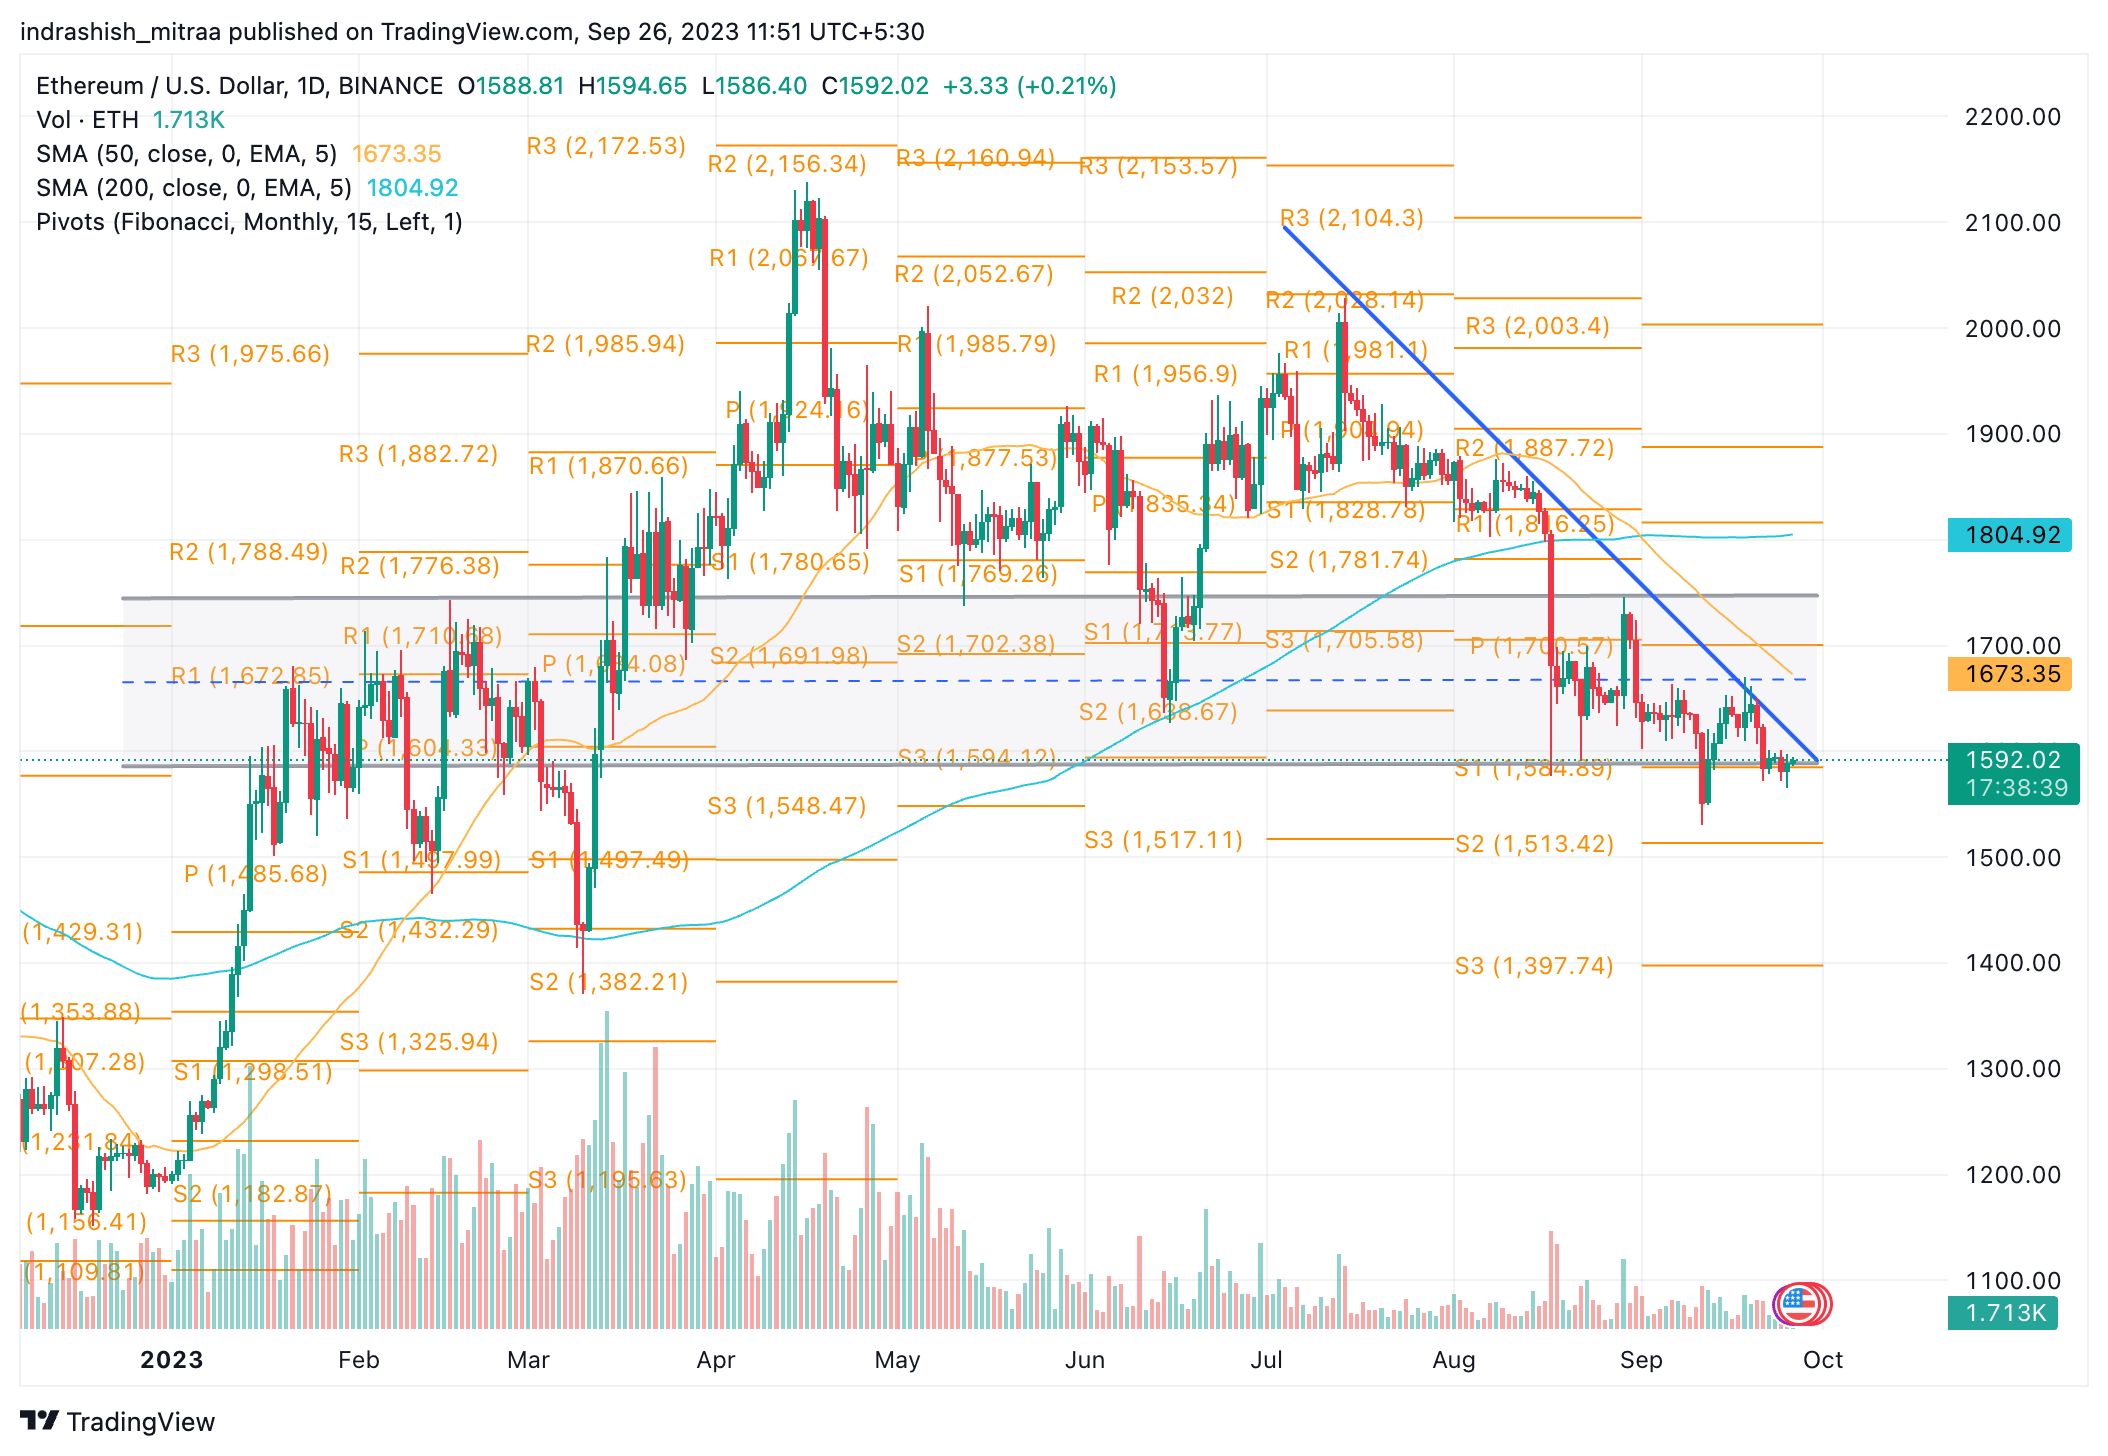
ETH/USD | Source: TradingView
- While Bitcoin exhibits signs of a rebound, Ethereum’s price has largely remained static in recent weeks.
- Ethereum is still a considerable distance away from reaching its central Fibonacci pivot point at $1,700. Despite Bitcoin’s recent gains, ETH’s price hasn’t managed to align with this bullish trend.
- Overcoming the range between $1,670 and $1,700 presents a challenge for ETH’s price, primarily due to the presence of a bearish-inducing downward trendline, indicated in blue.
- On a more optimistic note, there’s potential for ETH to experience an upturn to $1,700 (P) and even progress to $1,816 (R1), as suggested by the Fibonacci pivot point levels. If bullish momentum remains strong, ETH might reach levels around $1,890 to $1,900 (R2).
- However, looking at the downside, the 50-day and 200-day exponential moving averages serve as substantial resistance levels, especially given their bearish crossover at the start of September 2023. These levels represent significant hurdles for ETH’s potential upward movement by the end of September.
- Turning our attention to potential losses, ETH’s price currently will find support at the $1,580 (S1) Fibonacci level, coinciding with the lower boundary of the consolidation range, as highlighted in grey.
Learn More: Ethereum Price Prediction
LINK Price Rallies Nearly 30% in September!
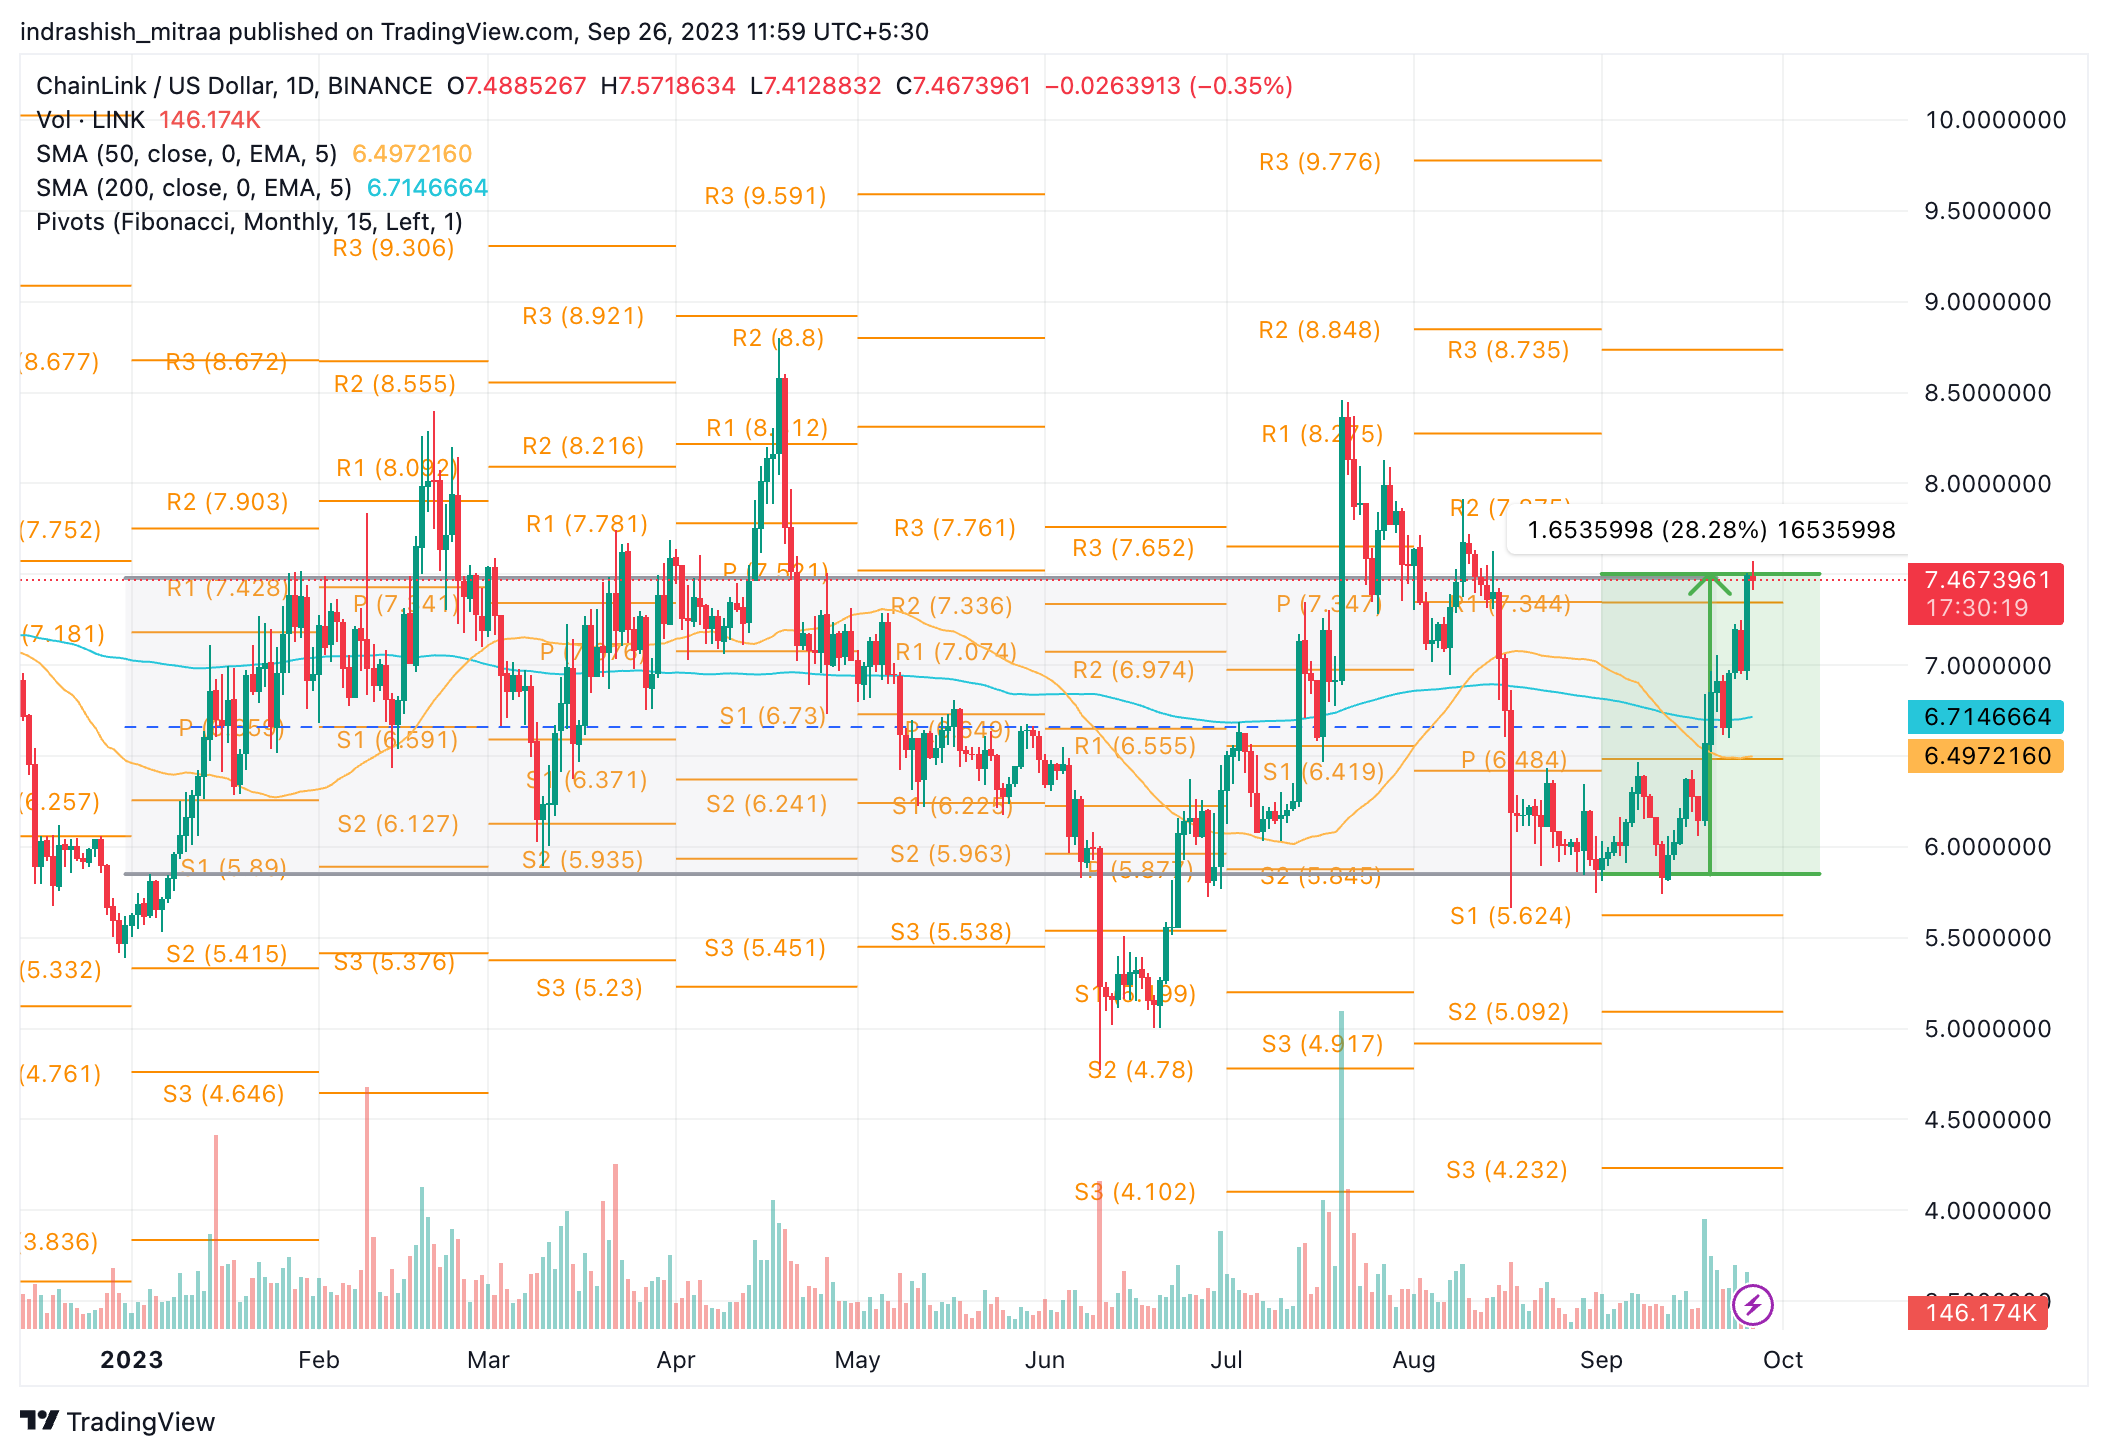
LINK/USD | Source: TradingView
- In 2023, Chainlink (LINK) stands out as one of the more impressive performers, despite the prevailing bearish trend. According to data from CoinMarketCap, LINK’s price has risen by approximately 29% year-to-date. As illustrated in the chart above, after a brief dip in August, LINK’s price experienced a significant 28% recovery in September too.
- Nevertheless, amid the ups and downs of 2023, it’s evident that the value of LINK has primarily traded within a consistent range (indicated in grey), roughly ranging from $6 to $7.5.
- This range has demonstrated remarkable resilience throughout the year, even in the face of multiple attempts to break out of it. LINK’s price made three attempts to surpass the range and one attempt to fall below it, but each of these efforts was swiftly reversed.
- Looking ahead, LINK’s price appears to be gathering bullish momentum for the immediate future. However, history suggests that this momentum might be short-lived unless there is a broader crypto market recovery.
- In September alone, Chainlink’s price rebounded from the recent Fibonacci pivot S1 level and surged to the R1 level, located near $7.3. If a breakout occurs beyond this R1 level, it would bode well for the token. The subsequent targets are $7.8 (R2) and a substantial 20% increase towards $8.7 (R3).
- On the downside, Chainlink’s price could find support near $5.5, which aligns closely with the S2 level of the Fibonacci pivot point indicator.
- Additionally, as long as LINK’s price maintains levels above the year-to-date low of $5, the likelihood of pullback rallies in the future remains reasonably strong.
WLD Price Gains 80% in September!
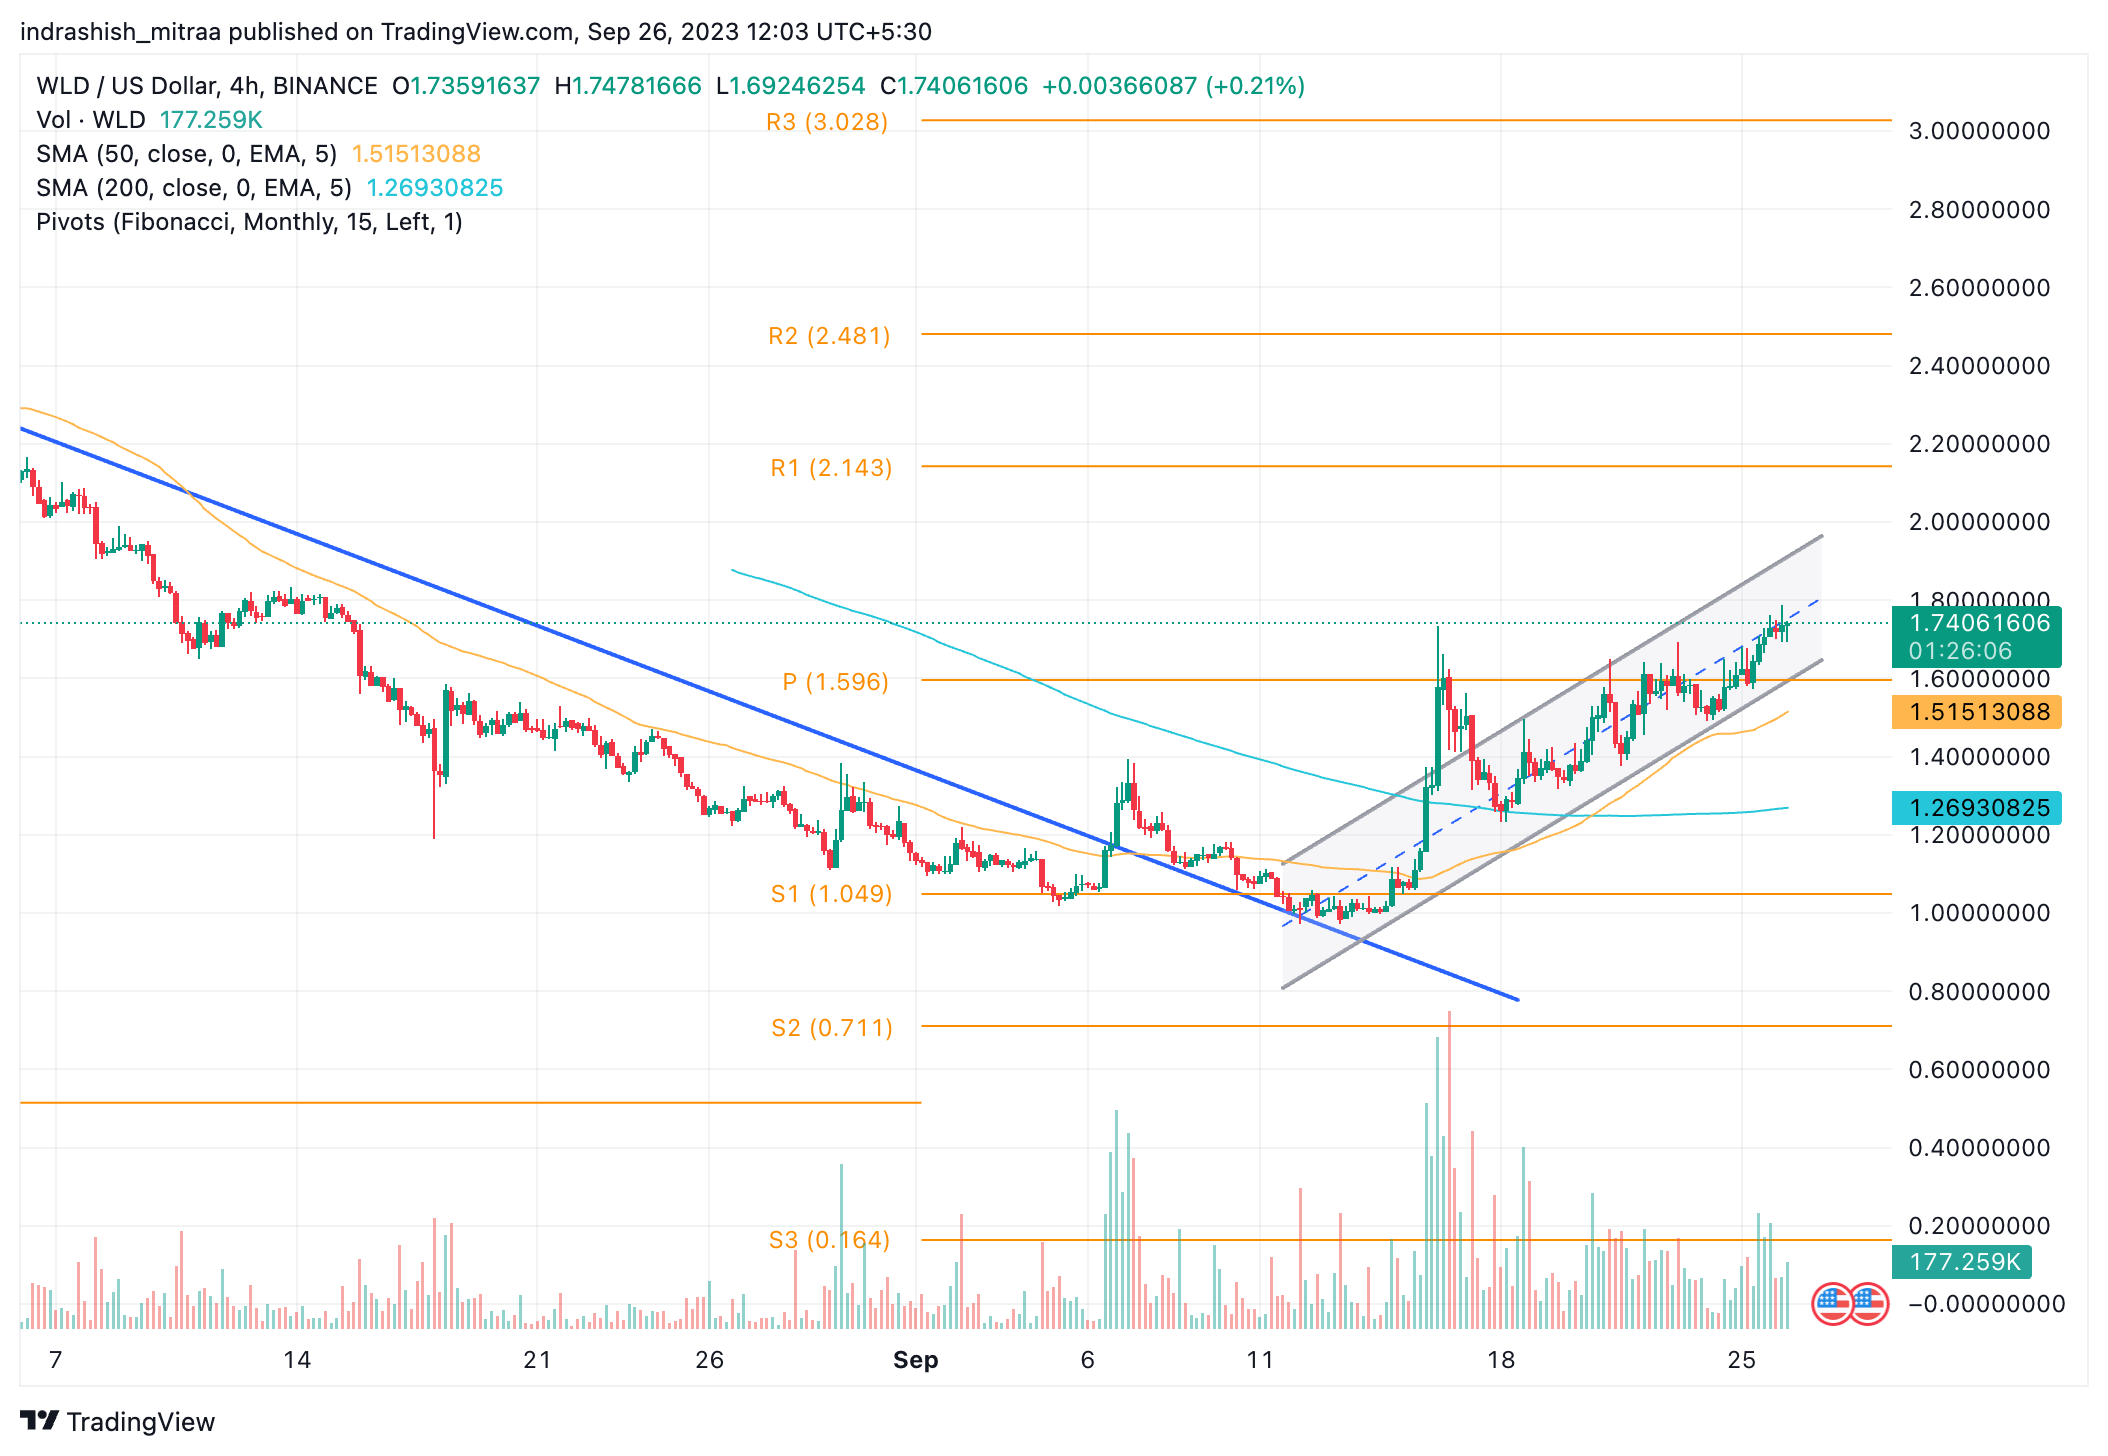
WLD/USD | Source: TradingView
- One of the more recent listings on this list, Worldcoin is a token that saw major losses ever since it started trading publicly in the open market. However, since mid-September, WLD price has begun showing some green shoots.
- WLD price has gained a solid 80% from September lows and is now trading at the highest point in the past month – displaying some very optimistic technical indications.
- WLD price has broken out of both the 50-period and the 200-period exponential moving averages, and the two EMAs have also undergone a bullish golden crossover, which would provide further upside support.
- WLD price has also been trading within a very strong upward channel (marked in grey) and can be expected to follow that going forward too.
- On the upside, the price targets for WLD include $2.14 – which is R1 of the Fibonacci pivot level, and if that is breached, we can see a follow-on rally up to $2.5 too! This would result in a further 45% rally from current levels.
- On the downside, the psychological mark of $1 would serve as a region of support for the WLD token price, and also, since it is the lowest point of 2023, from where the WLD prices saw a major recovery.
Read On: Worldcoin Price Prediction
PEPE Continues its Downward Trajectory in 2023
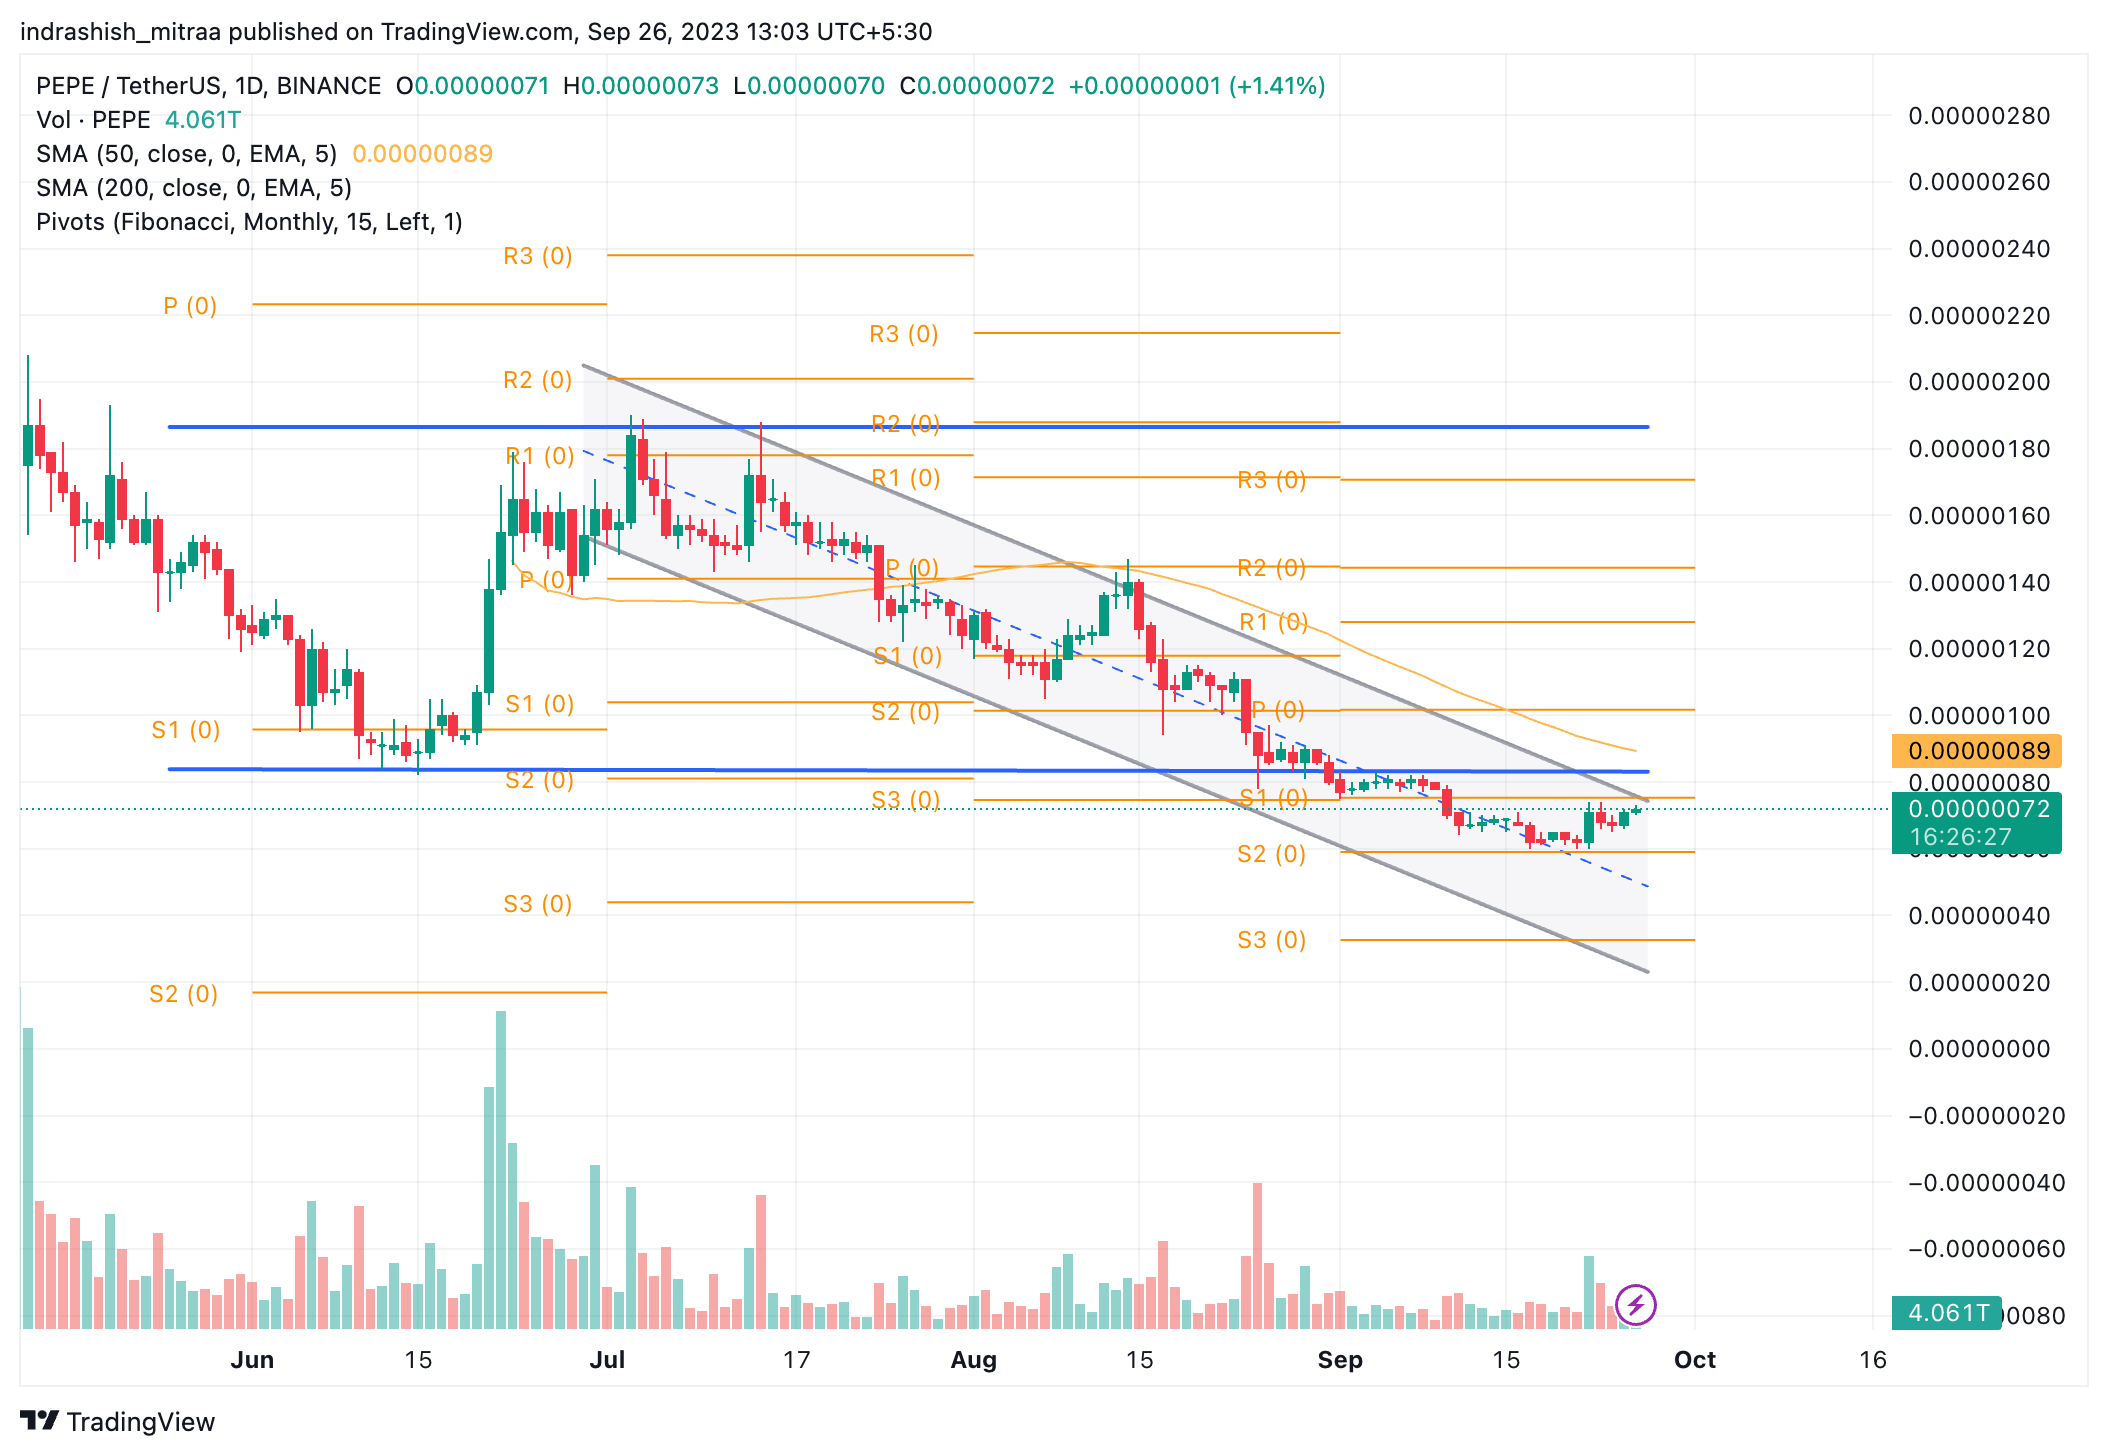
PEPE/USD | Source: TradingView
- PEPE price embarked on its journey amidst considerable excitement, experiencing initial gains upon listing. However, it was soon overshadowed by a bearish sentiment, resulting in a steep decline. As observed in the chart above, the price plummeted by more than 60% in just a month. In mid-June, there was an attempt at recovery, but it was swiftly met with selling pressure. This led to a continued downward trajectory, ultimately breaking its all-time lows by the end of August 2023.
- Currently, PEPE’s price finds support at the S2 level, as indicated by the Fibonacci pivot points on the chart. Moreover, it is trading below its 50-day exponential moving average.
- Restoring market enthusiasm for PEPE requires overcoming critical resistance zones on the chart. The initial challenge lies within the region between S1 and the pivot point (P). This zone also encompasses the former all-time low area, which could now serve as a potential resistance level. Thus, a breakout beyond this zone holds significant importance.
- Looking ahead, should PEPE successfully breach these levels in the upcoming months, there is potential for a continuation rally toward R1 at $0.00000128. This would represent a substantial 100% increase from the current levels. Such a surge would likely depend on a broader crypto market recovery and a corresponding uptrend in Pepecoin’s price.
- PEPE’s price currently grapples with pronounced bearish pressures, with a notable decline of over 21% in the past 30 days and nearly 46% in the past 60 days. Consequently, it is imperative for PEPE’s price to maintain levels above the S2 support, which stands at $0.0000006 according to the Fibonacci pivot points.
Additional Read: Pepe Price Prediction
Overall Crypto Market Wrap-Up
When examining the crypto market as a whole, it’s clear that it has mostly hovered around the $1 trillion total market capitalization mark. In the past month, market performance has swung between $1 trillion and $1.08 trillion. However, the current sentiment leans somewhat bearish, indicating underlying weaknesses in the market’s fundamentals. The dominant trend has indeed shifted towards bearishness, marked by significant events such as all major Exponential Moving Averages (EMA) undergoing a death cross, coupled with precarious support levels.
In light of these factors, a path to recovery demands a more widespread and comprehensive resurgence across the market. Such a resurgence is crucial to fostering substantial and sustainable bullish momentum in the near future.
Values as of September 26, 2023.
Related posts

Bitcoin Price Hits New All-Time High Following Fed’s 25-Basis-Point Rate Cut
Fed’s interest rate cut spurs crypto momentum, boosting Bitcoin and Ethereum prices.
Blum Secures Major Investment from TOP to Strengthen DeFi Presence in TON Ecosystem
TOP’s backing aims to accelerate Blum’s multi-blockchain expansion.