
Key Takeaways:
- SOL’s Rollercoaster Ride: Solana’s native token, SOL, has witnessed a tumultuous journey in 2023. After surging from sub-$10 levels to nearly $26 earlier in the year, it experienced a major crash in June, plummeting to $14. Despite the volatility, SOL displayed a remarkable recovery, briefly touching $30 and currently trading around $18.
- Symmetrical Triangle Formation: SOL’s technical charts reveal the formation of a symmetrical triangle pattern, a pivotal juncture for this altcoin. A breakout in either direction could signal a significant price movement.
- On-chain Metrics: Solana’s on-chain metrics provide insights into its evolving ecosystem. The Active Address Count exhibited a downward trend throughout 2023, reflecting the impact of an extended bear market. Meanwhile, the Value Moved On Chain revealed a decline in on-chain activity compared to the remarkable highs observed in late 2021 and early 2022.
Read More: Solana Price Prediction
Solana Technical Overview
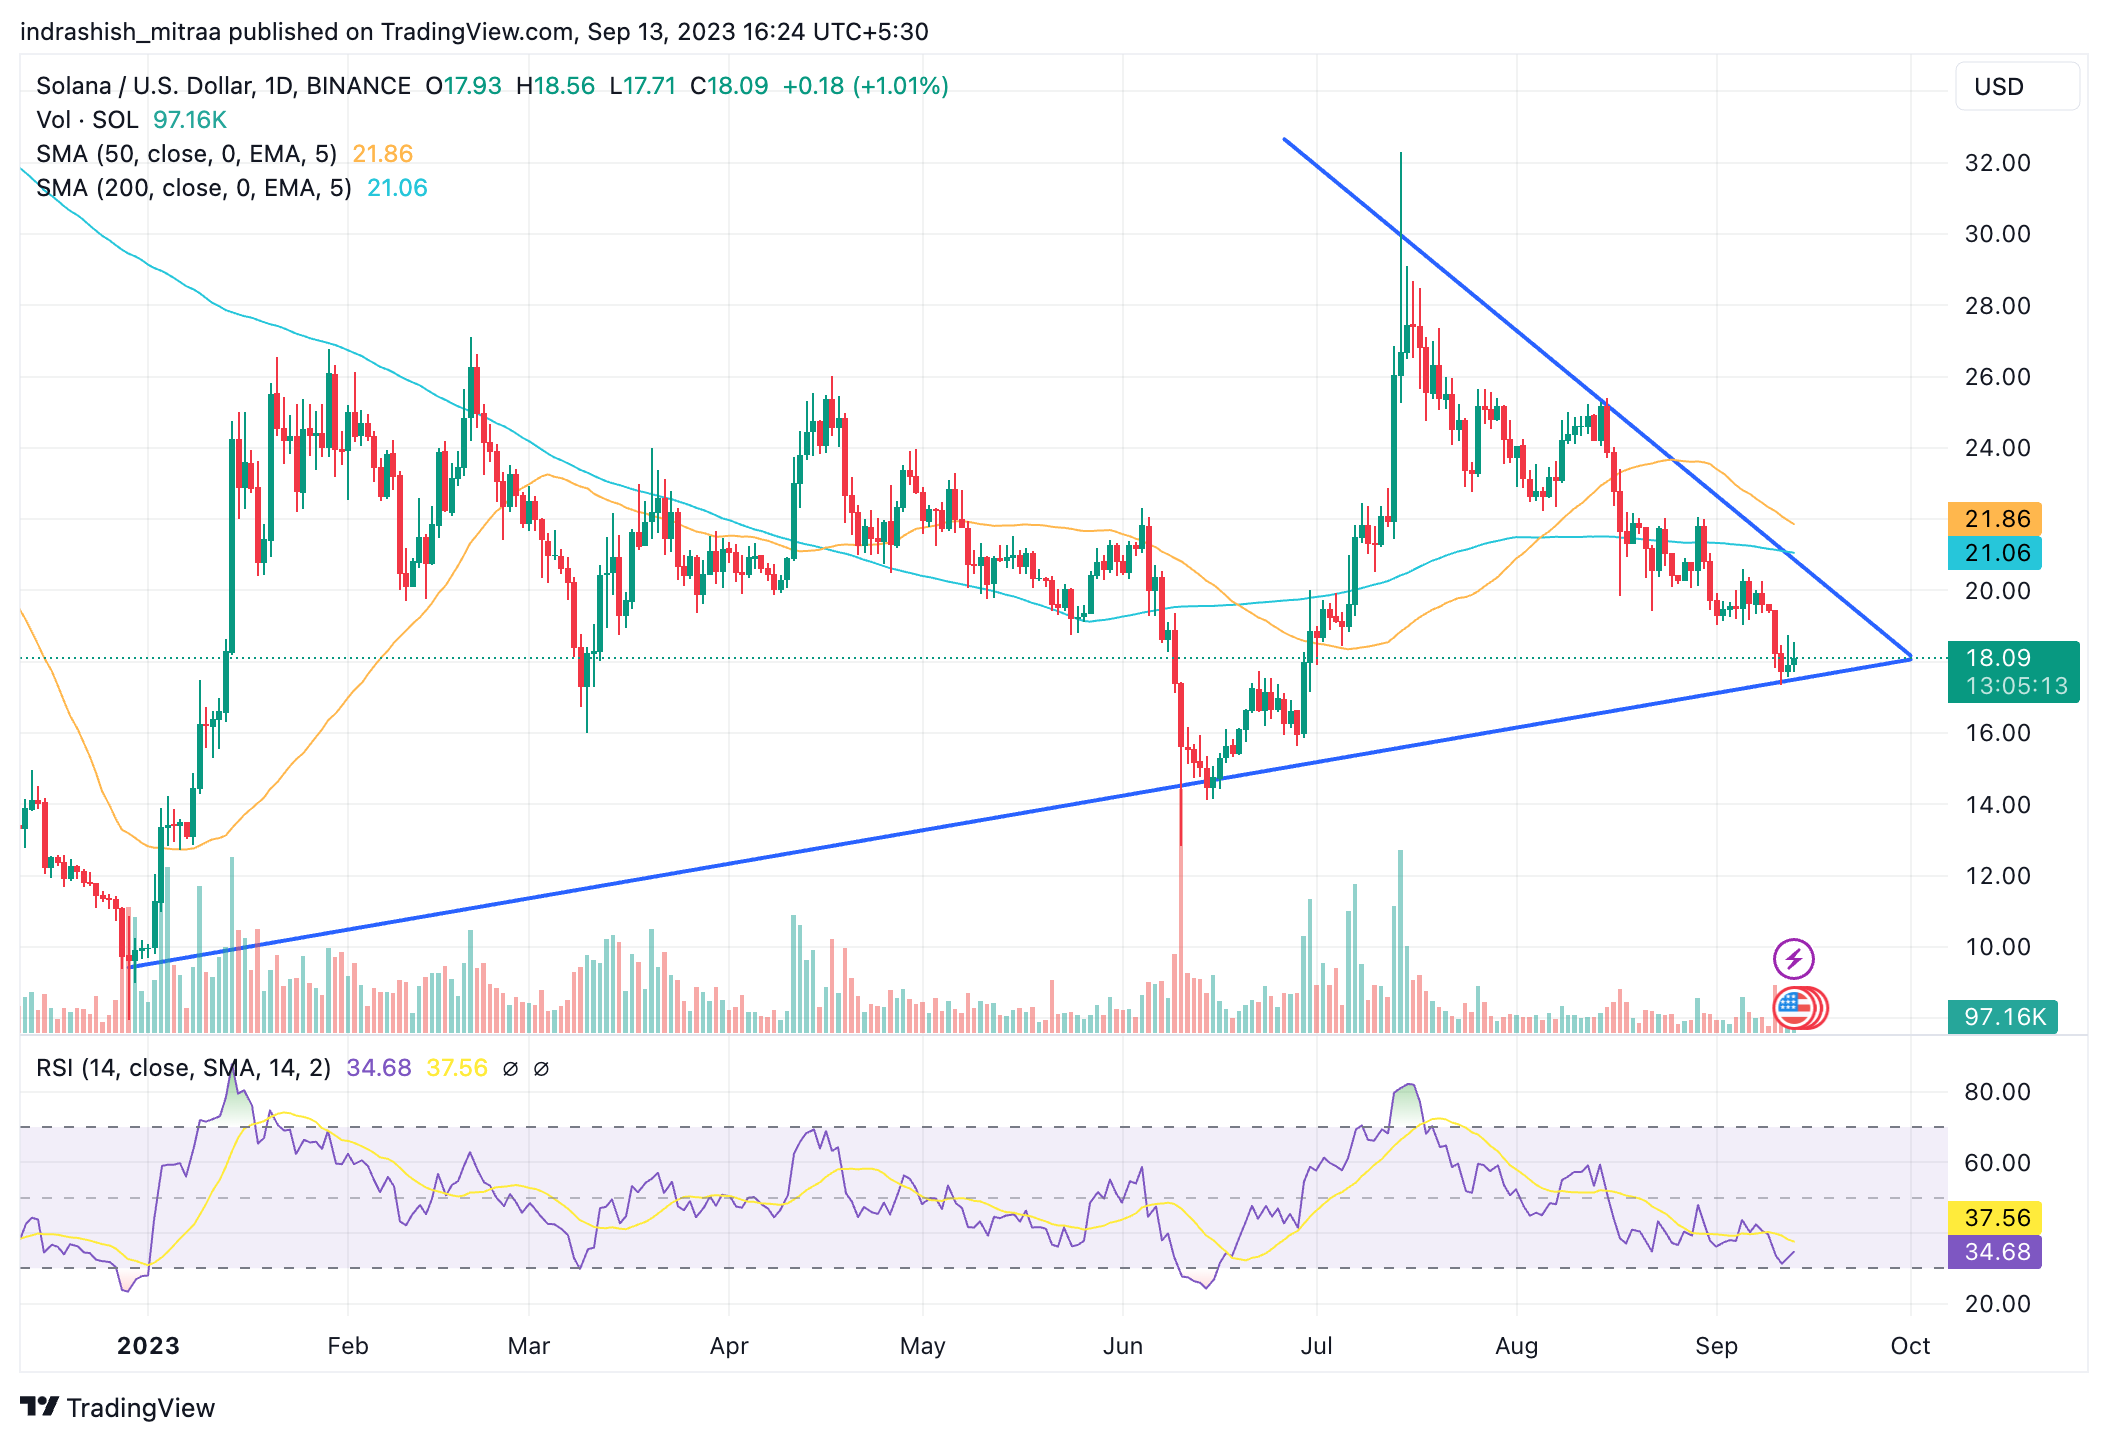
SOL/USD | Source: TradingView
- From a technical perspective, Solana’s native token, SOL, saw a major upward move early in the year going from sub-$10 levels all the way to touch near $26 region.
- Between February to May 2023, SOL token’s price managed to hold its value and stay above the crucial $20 support level on the charts, but eventually, in June 2023 saw a major crash which brought the SOL price down to $14.
- But quickly after that, Solana saw one of the best recoveries amongst the top 10 cryptos by market capitalization as of writing this article, going from the $14 level all the way to touch $30 briefly and then falling again to trade around $18 currently.
- Overall, the SOL token price has formed a symmetrical triangle pattern on the charts – a crucial make or break for this altcoin. A breakout in either direction would result in a consecutive rally or a crash, whatever the case.
- The crucial levels to look out for are $20 on the upside, which would act as a region of resistance, and $14 would serve as a support zone on the downside.
- SOL’s Relative Strength Index is currently trading below 35, which is a slightly oversold zone, and thus we could see some buying happening during dips.
- On the other hand, SOL’s 50-day and 200-day exponential moving averages are almost on the verge of undergoing a bearish crossover, also known as a death cross. Plus, SOL price is trading below both the 50 and 200-day EMAs, which will bring in some bearishness in the market.
Solana On-chain Overview
Solana Active Addresses Count
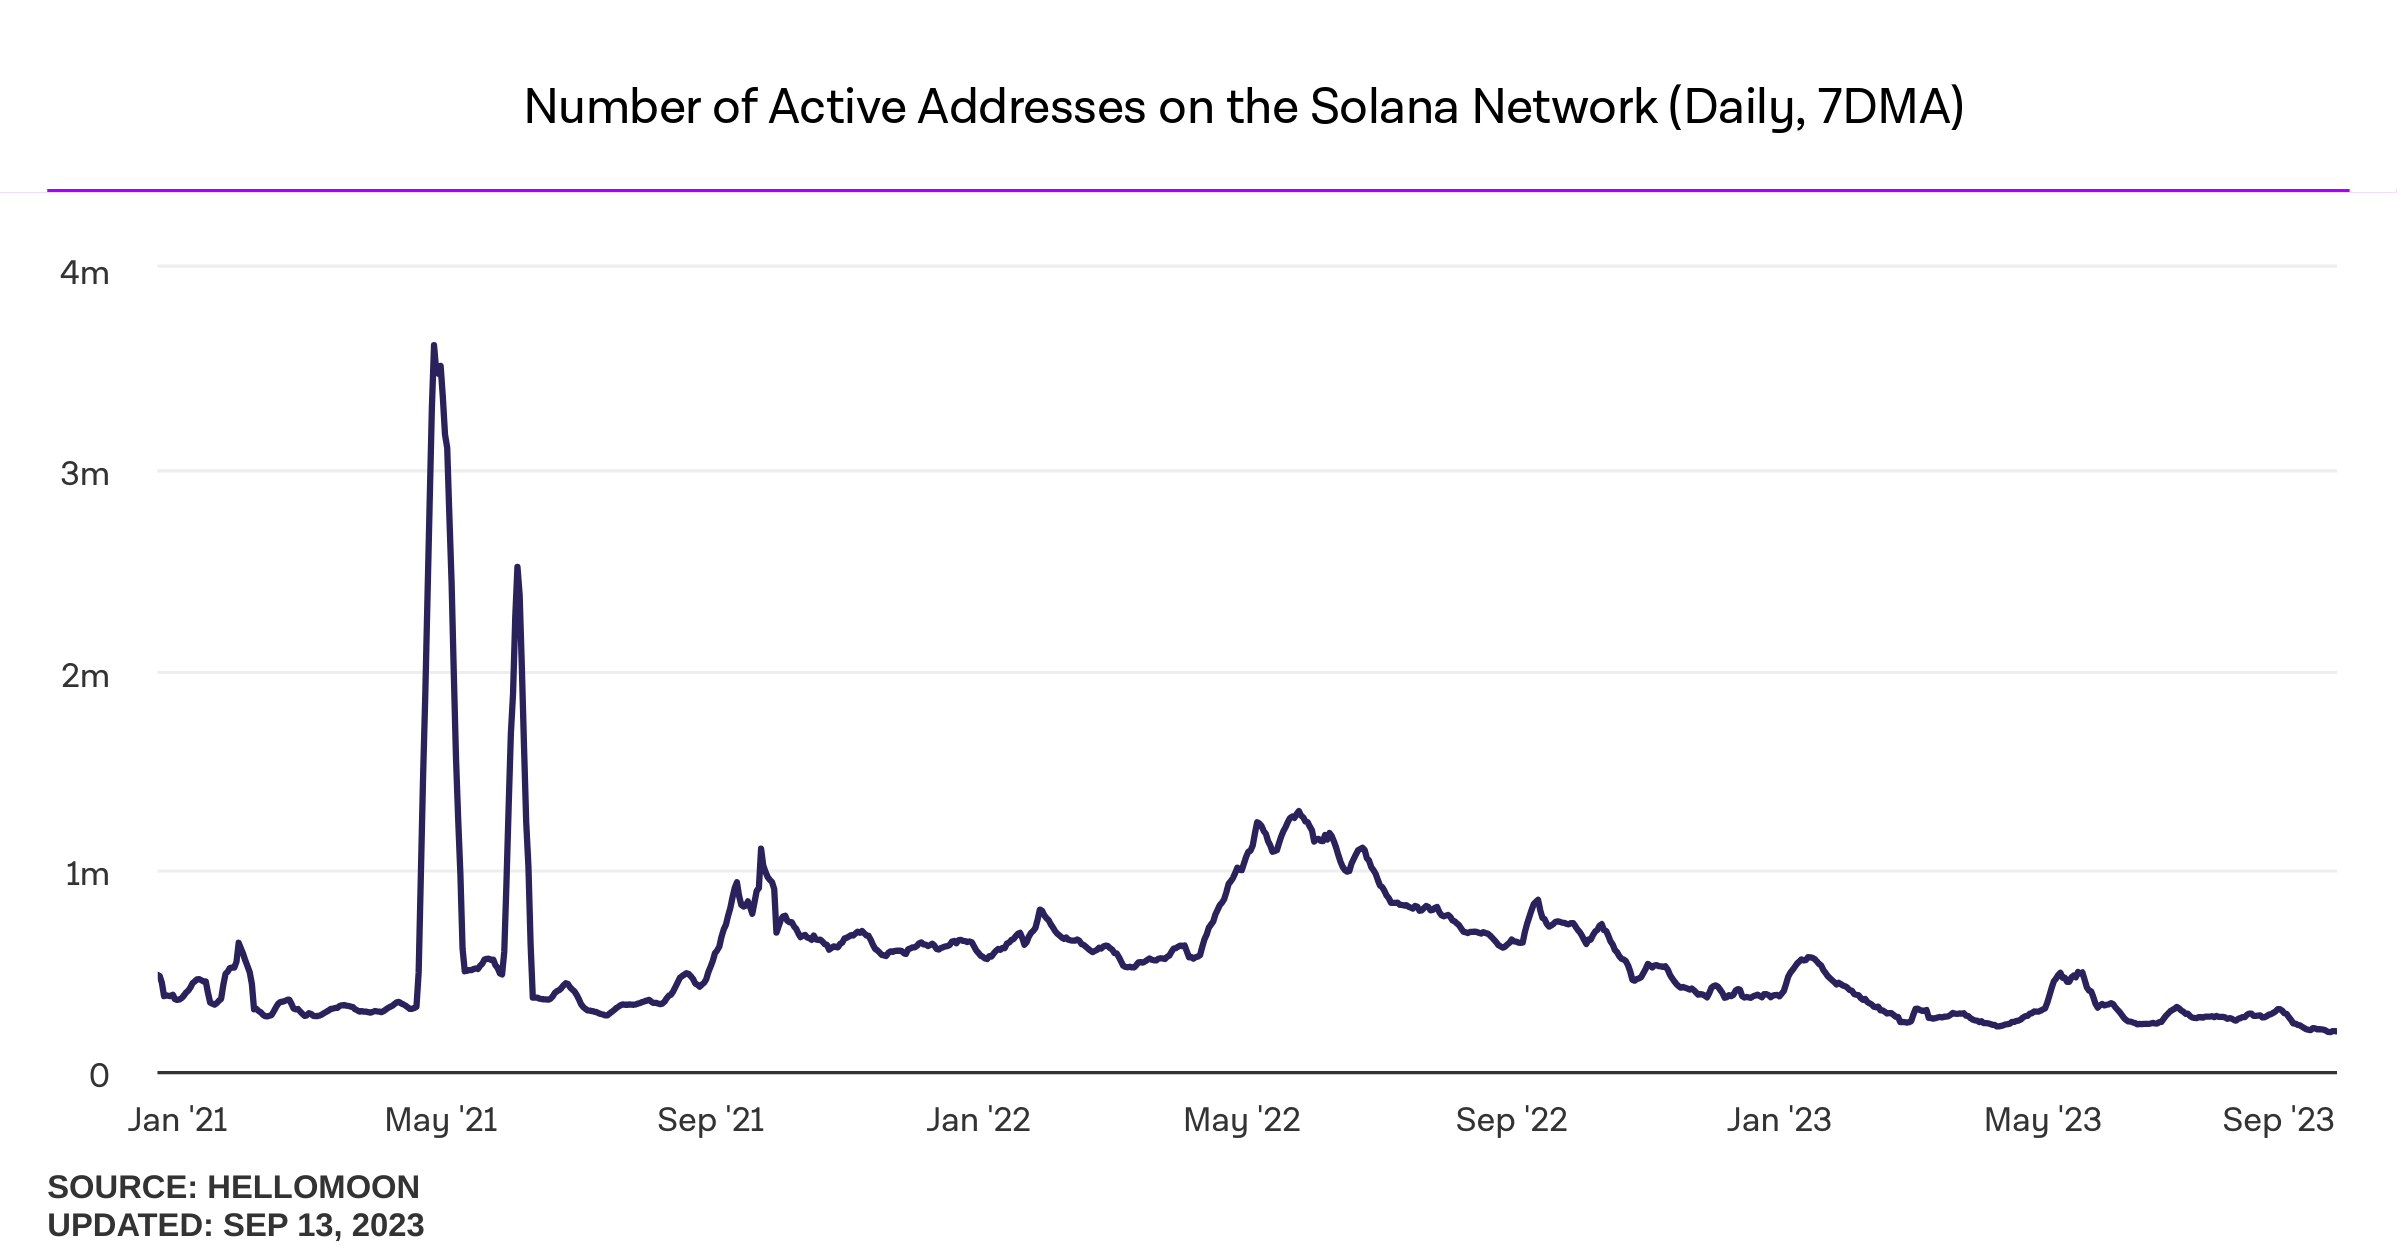
Solana Active Addresses Count | Source: IntoTheBlock
As one can observe from the chart above, Solana’s Active Address Count on the network has been on a downward trend in 2023. In fact, since the beginning of 2023, Solana’s active address count has gone from a high of 566k down to 200k as of writing, scripting a 65% drop. Looking back at 2021, Solana saw massive active address counts on its blockchain, especially in May 2021, when we saw the first phase of 2021’s bull run. But ever since the beginning of the bear run, starting in May 2022, Solana’s active address count has been on a consistent downward trend. While this is a concerning metric, a drop in the active address count on a blockchain network can be expected, especially during a bear market as long-drawn as the one we are observing now.
Solana Value Moved On Chain (Monthly)
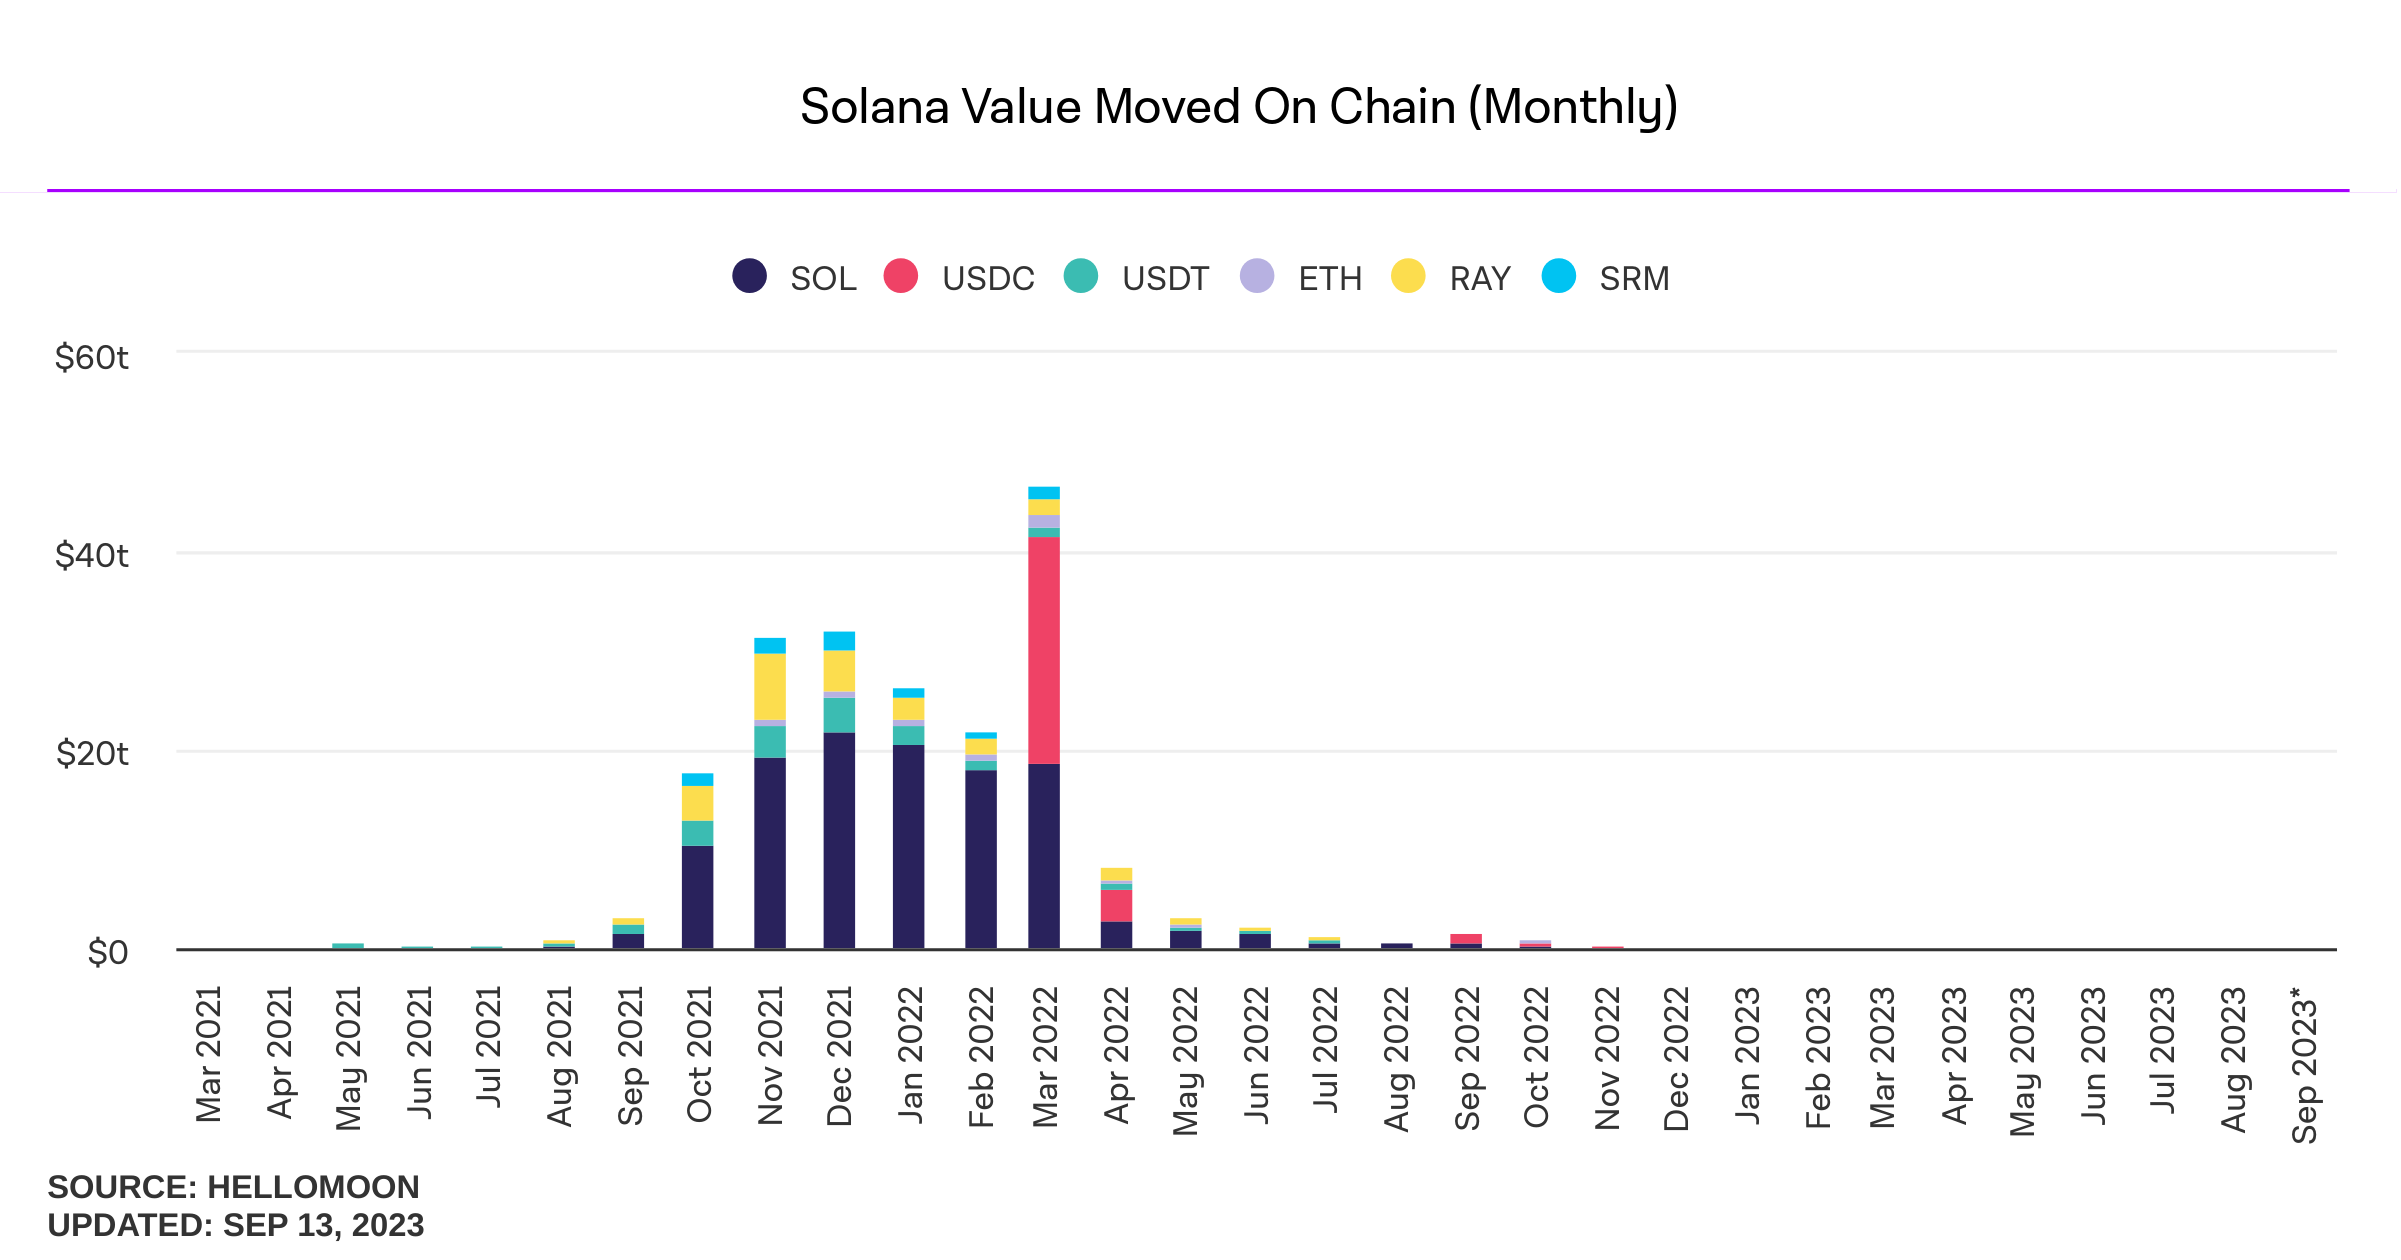
Solana Value Moved On Chain (Monthly) | Source: IntoTheBlock
While Solana (SOL) once experienced a meteoric rise in on-chain value movement, late 2021 and early 2022 marked an era of significant activity. However, the blockchain’s landscape has since evolved. As depicted in the graph above, Solana witnessed a substantial decrease in on-chain value movement over recent months. This reduction signifies a shift in the altcoin’s ecosystem as activity finds new focal points.
Additional Read: Bitcoin Technical Analysis
Conclusion
Solana’s journey in 2023 has been a rollercoaster of price fluctuations and evolving on-chain metrics. As it navigates critical support and resistance levels within a symmetrical triangle pattern, the market awaits a decisive move. Meanwhile, the decline in active addresses and on-chain value movement signals a shifting landscape within Solana’s ecosystem. These metrics and technical factors will play a crucial role in shaping SOL’s path in the crypto space.
Values as of September 13, 2023.
FAQs
Related posts

Bitcoin Price Hits New All-Time High Following Fed’s 25-Basis-Point Rate Cut
Fed’s interest rate cut spurs crypto momentum, boosting Bitcoin and Ethereum prices.
Blum Secures Major Investment from TOP to Strengthen DeFi Presence in TON Ecosystem
TOP’s backing aims to accelerate Blum’s multi-blockchain expansion.