
Introduction
In the world of crypto trading and investing, indicators play a crucial role in analyzing market trends and making informed decisions. These tools help traders and investors navigate the complex and volatile crypto market by providing valuable insights into price movements and potential opportunities. Among the plethora of trading indicators available, the rainbow chart has emerged as a powerful tool that deserves a place in every trader’s arsenal.
The rainbow chart, also known as the Bitcoin rainbow chart or rainbow chart in crypto trading, is a unique visual representation of historical price data that helps traders identify potential trends and market cycles. This indicator utilizes various trading indicator models and presents them in a color-coded format, offering a comprehensive view of Bitcoin’s price performance over time.
With the rainbow chart, traders can quickly assess whether the current price of a crypto asset is overbought or oversold, enabling them to make more informed trading decisions and exploit opportunities. By utilizing different colors to represent different price ranges, the rainbow chart simplifies the interpretation of market trends and helps traders identify optimal entry and exit points.
In the following sections of this article, we will delve deeper into the mechanics of the rainbow chart, explore how to interpret and utilize it effectively and discuss its limitations. So, let’s embark on this journey of understanding the rainbow chart and unlock its potential in crypto trading.
Read More: Bitcoin Stock-To-Flow Model Explained
What is a Rainbow Chart?
The rainbow chart is a popular trading indicator that provides a visual representation of historical price data for cryptos, including Bitcoin. It offers valuable insights into market trends, price cycles, and potential turning points. Here’s what a Bitcoin Rainbow Chart looks like:
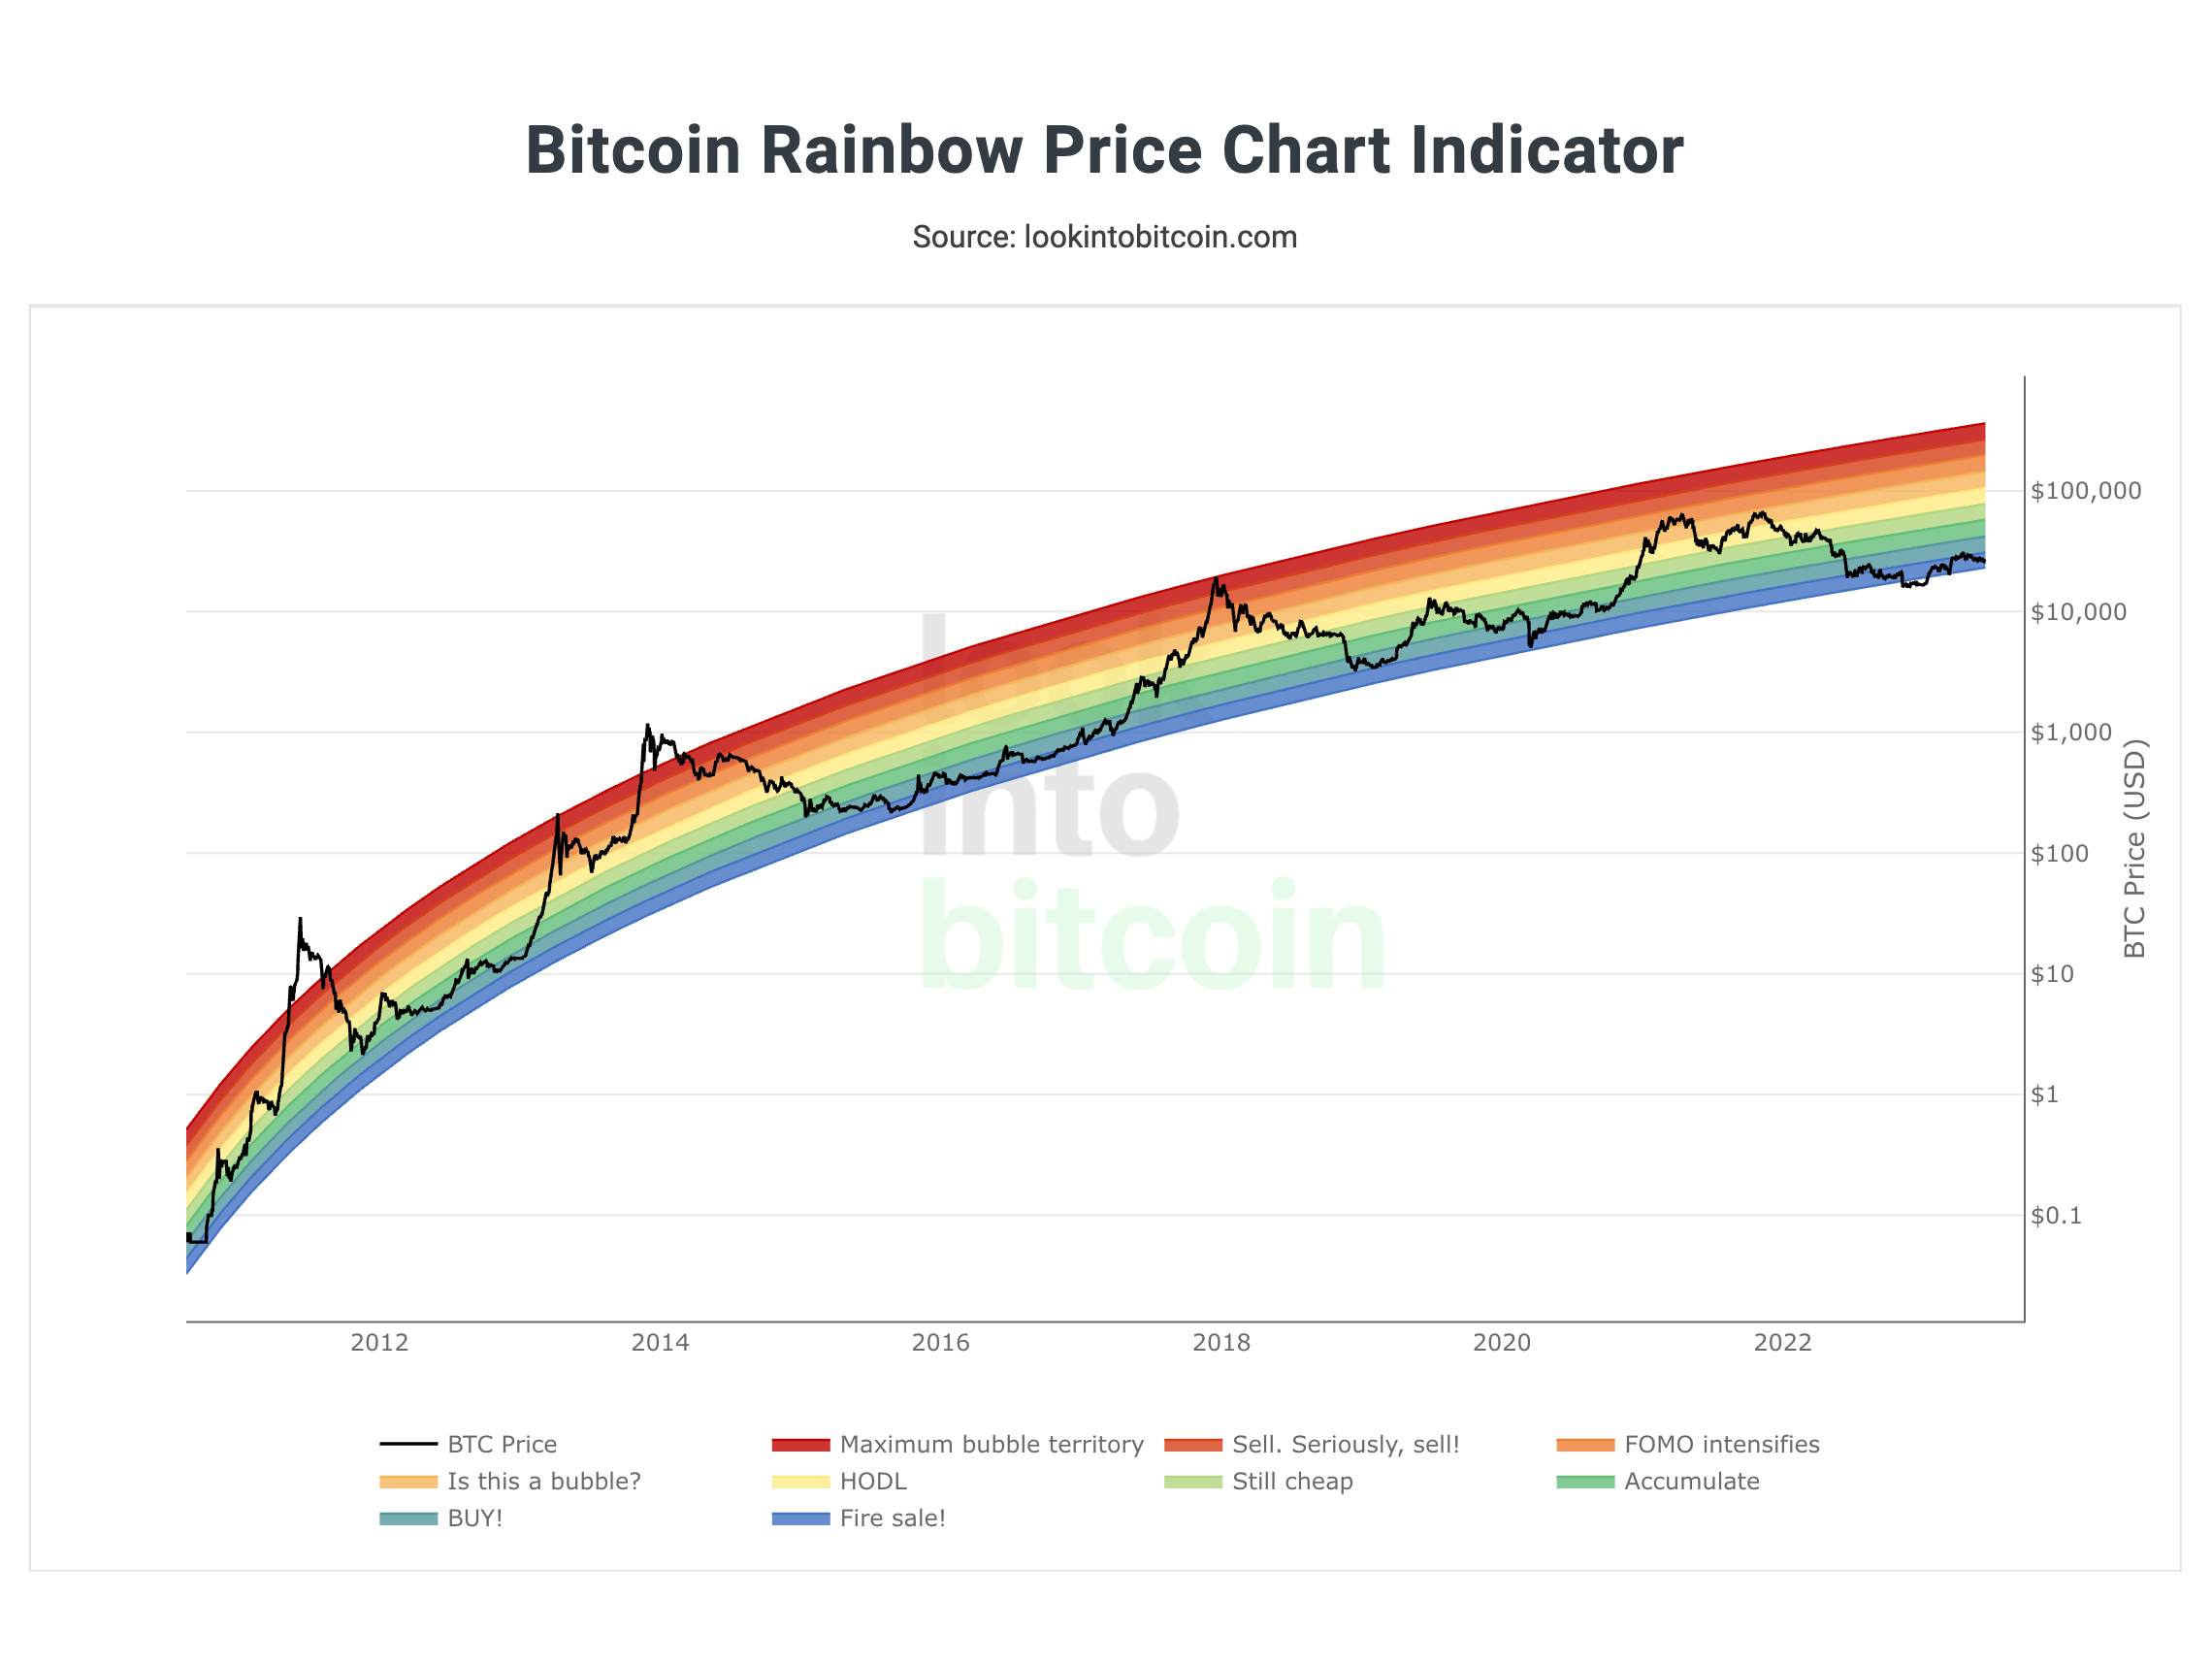
Bitcoin Rainbow Chart | Source: LookIntoBitcoin
Here’s a closer look at what makes the rainbow chart an essential tool for traders:
- History: The concept of the rainbow chart was first introduced by a trader and analyst known as Bitcoin talk user “Trolololo” in 2014. It gained popularity in the crypto community due to its ability to simplify the analysis of long-term price trends.
- Use and Interpretation: The rainbow chart is used to assess the relative position of the current price in relation to its historical price range. It helps traders identify overbought and oversold conditions and potential support and resistance levels. The chart consists of multiple horizontal bands or lines, each representing a specific price range.
- Color-Coded Bands: One of the key features of the rainbow chart is its color-coded bands. Each band represents a different price range, and the colors change progressively from one end of the spectrum to the other. For example, the lower price ranges may be represented by shades of red, while the higher ranges are depicted in shades of green or blue.
- Long-Term Perspective: Unlike many other trading indicators that focus on short-term trends, the rainbow chart provides a long-term perspective. It incorporates historical price data spanning several years, allowing traders to identify significant price levels and potential trend reversals.
- Identifying trends, support & resistance levels and reversals: By analyzing the position of the current price in relation to the color-coded bands, traders can identify the overall trend of the market. The rainbow chart also helps traders identify potential support and resistance levels. When the price approaches a specific band, it may encounter resistance or support based on historical price action. Additionally, traders often monitor the rainbow chart for potential trend reversals.
The rainbow chart serves as a useful tool for traders looking to gauge the overall trend, identify potential buying or selling opportunities, and manage risk effectively. However, it is important to note that the rainbow chart, like any other trading indicator, has its limitations and should be used in conjunction with other technical analysis tools for comprehensive market analysis.
Using the Rainbow Chart For Crypto Trading
The rainbow chart is a powerful tool that can assist crypto traders in making informed decisions about entry and exit points in the market. By understanding how to interpret the chart and its color-coded bands, traders can gain valuable insights into potential buying and selling opportunities. Here’s how you can use the rainbow chart for crypto trading:
- Identify Trend Direction: The position of the current price in relation to the color-coded bands can help determine the overall trend direction. If the price is closer to the higher bands, it indicates a bullish trend, while a price closer to the lower bands suggests a bearish trend. This information can guide your trading decisions and help you align with the prevailing trend.
- Assess Overbought and Oversold Conditions: The rainbow chart allows you to identify overbought and oversold conditions in the market. When the price reaches the upper bands, it may indicate an overbought condition, signaling a potential reversal or correction. Conversely, when the price reaches the lower bands, it may suggest an oversold condition, indicating a potential buying opportunity.
- Find Support and Resistance Levels: The rainbow chart helps you identify significant support and resistance levels. When the price approaches a specific band, it may encounter resistance or support based on historical price action. These levels can serve as potential entry or exit points for your trades.
- Look for Color Band Crossovers: Pay attention to instances where the price crosses multiple color bands in either direction. Such crossovers can indicate a potential trend reversal. For example, if the price moves from the higher bands to the lower bands, it might signal a shift from a bullish to a bearish trend, or vice versa.
- Trend Reversals: Traders often monitor the rainbow chart for potential trend reversals. If the price crosses multiple bands in either direction, it may indicate a shift in the market sentiment and the possibility of a trend reversal.
- Combine with Other Indicators: While the rainbow chart is a valuable tool on its own, it is recommended to use it in conjunction with other technical analysis indicators to strengthen your trading strategy. Consider combining it with indicators like moving averages, volume analysis, or trend lines to gain a more comprehensive view of the market.
Remember, the rainbow chart is a supplementary tool and should not be relied upon as the sole basis for making trading decisions. It is essential to conduct thorough research, consider fundamental factors, and use multiple indicators to validate your analysis before entering or exiting trades. By incorporating the rainbow chart into your trading arsenal, you can enhance your ability to identify potential opportunities and improve your overall trading performance.
Limitations of Rainbow Chart
While the rainbow chart can be a valuable tool for crypto traders, it is important to understand its limitations and potential drawbacks. Here are some limitations to consider when using the rainbow chart for crypto trading:
- Lagging Indicator: The rainbow chart is a lagging indicator, meaning it relies on past price data to generate its color-coded bands. As a result, it may not provide real-time signals or accurately capture rapid market changes. Traders should be aware that by the time a signal is generated on the chart, the market conditions may have already shifted.
- Historical Data Reliance: The rainbow chart is based on historical price data, and its color-coded bands are determined by specific price percentiles. It assumes that historical patterns will repeat in the future, which may not always hold true in the dynamic and ever-changing crypto market.
- Lack of Contextual Information: The rainbow chart provides a visual representation of price movement and trend direction but does not provide detailed contextual information about the underlying factors influencing the market.
- Subjectivity in Interpretation: The interpretation of the rainbow chart can vary among traders, as it involves subjective analysis and personal judgment. Different traders may have different thresholds for identifying trend reversals or overbought/oversold conditions.
It is important to approach the rainbow chart with a balanced perspective, considering its limitations alongside its benefits. Traders should develop a robust trading strategy that incorporates various indicators, risk management techniques, and fundamental analysis to make informed decisions in the dynamic and volatile crypto market.
Conclusion
In conclusion, the rainbow chart is a popular and visually appealing trading indicator used in crypto trading. It provides traders with a comprehensive view of price trends and potential market reversals. By analyzing the color-coded bands, traders can identify key support and resistance levels, gauge market sentiment, and make more informed trading decisions.
While the rainbow chart has its limitations, such as being a lagging indicator and relying on historical data, it can still be a valuable tool when used in conjunction with other indicators and analysis techniques. It is important to remember that no single indicator can guarantee success in the volatile crypto market. Therefore, traders should exercise caution, conduct thorough research, and consider multiple factors before making trading decisions.
In summary, the rainbow chart is a powerful tool that can assist traders in understanding market trends, identifying potential trading opportunities, and managing risks. By harnessing the insights provided by the rainbow chart and applying it within a comprehensive trading strategy, traders can enhance their decision-making process and strive for success in the exciting world of crypto trading.
FAQs
Who created Bitcoin rainbow chart?
The Bitcoin rainbow chart was not created by a specific individual. It is a visual representation of historical price data that has been popularized within the crypto community. The chart's color-coded bands and patterns have been widely used and shared by traders and analysts as a trading indicator in the crypto market.
Is the Bitcoin Rainbow Chart Accurate?
The accuracy of the Bitcoin rainbow chart, like any trading indicator, is subject to interpretation and market conditions. While it can provide insights into historical price trends and potential support and resistance levels, it should not be relied upon as the sole factor for making trading decisions. Traders and investors should consider using the rainbow chart in conjunction with other technical analysis tools and fundamental factors for a more comprehensive approach.
Related posts

Understanding the Different Types of Cryptos: Coins, Tokens, Altcoins & More Explained
Explore the major types of crypto assets and their unique roles.

PAWS Telegram Game: The New Tap to Earn Game That Is Beating Hamster Kombat
Discover how to play and earn with PAWS Telegram game.