Table of Contents
ToggleIntroduction
As a trader, you are constantly looking for ways to improve your trading strategies and maximize your profits in the crypto market. One of the key factors in successful trading is understanding support and resistance levels. These levels can be difficult to identify, but with the use of options open interest data, you can gain valuable insights into the market and make more informed trading decisions.
In this article, we will explore how options open interest data can help you identify support and resistance levels in the crypto market. We will provide an overview of options’ open interest, explain how it can be used to identify support and resistance levels, and provide examples of how this data can be applied in your trading strategy.
By the end of this article, you will have a better understanding of how options open interest data can help you identify key levels in the market, and how you can use this information to improve your trading strategies and maximize your profits.
What are Options in Crypto Markets?
Before we get into the actual techniques to use options’ open interest to find support and resistance levels, let us quickly first understand what options are. Options are a popular derivative instrument in the financial world, and they have recently gained popularity in the crypto market as well. In simple terms, an option is a contract that grants the buyer the right, but not the obligation to buy or sell the underlying asset at a predetermined price within a specific time frame.
It is effectively yet another derivatives instrument, like Futures – which means that it is a contract that is based on an underlying asset, which is crypto in our case – and does not provide actual ownership of the underlying asset. In the crypto market, options provide traders with a way to hedge their positions, speculate on price movements, and limit their risk exposure. Options can be used to trade a variety of crypto, including Bitcoin, Ethereum, and some other altcoins.
There are two kinds of options that you can avail of, one is a call and option the other is a put option. Continuing from the definition above, a call option is a contract that grants the buyer the right, but not the obligation to buy the underlying asset at a predetermined price within a specific time frame. On the flip side, a put option is a contract that grants the buyer the right, but not the obligation to sell the underlying asset at a predetermined price within a specific time frame.
Thus, in a nutshell, if a trader thinks the price of the underlying is going to go up, one avails of call options, while if a trader thinks that prices may go down, the trader avails of put option.
Now, Let’s Understand What Open Interest Means
Open interest is a key concept in options trading, and it refers to the total number of outstanding contracts that have not been exercised or closed out by the end of any trading day. Open interest provides traders with valuable information about the level of activity and liquidity in the crypto options market, and it can help traders make more informed trading decisions.
In the crypto market, open interest is an important metric that can be used to analyze the level of interest and demand for options on a particular crypto. By tracking changes in open interest over time, traders can gain insights into market sentiment and identify potential trends and price movements.
When open interest is visualized and presented in the form of a table or a chart, it is known as an option chain. In the options market, an option chain provides a snapshot of all available options contracts, including their strike prices, expiration dates, and implied volatility.
How to Read Option Chain Data?
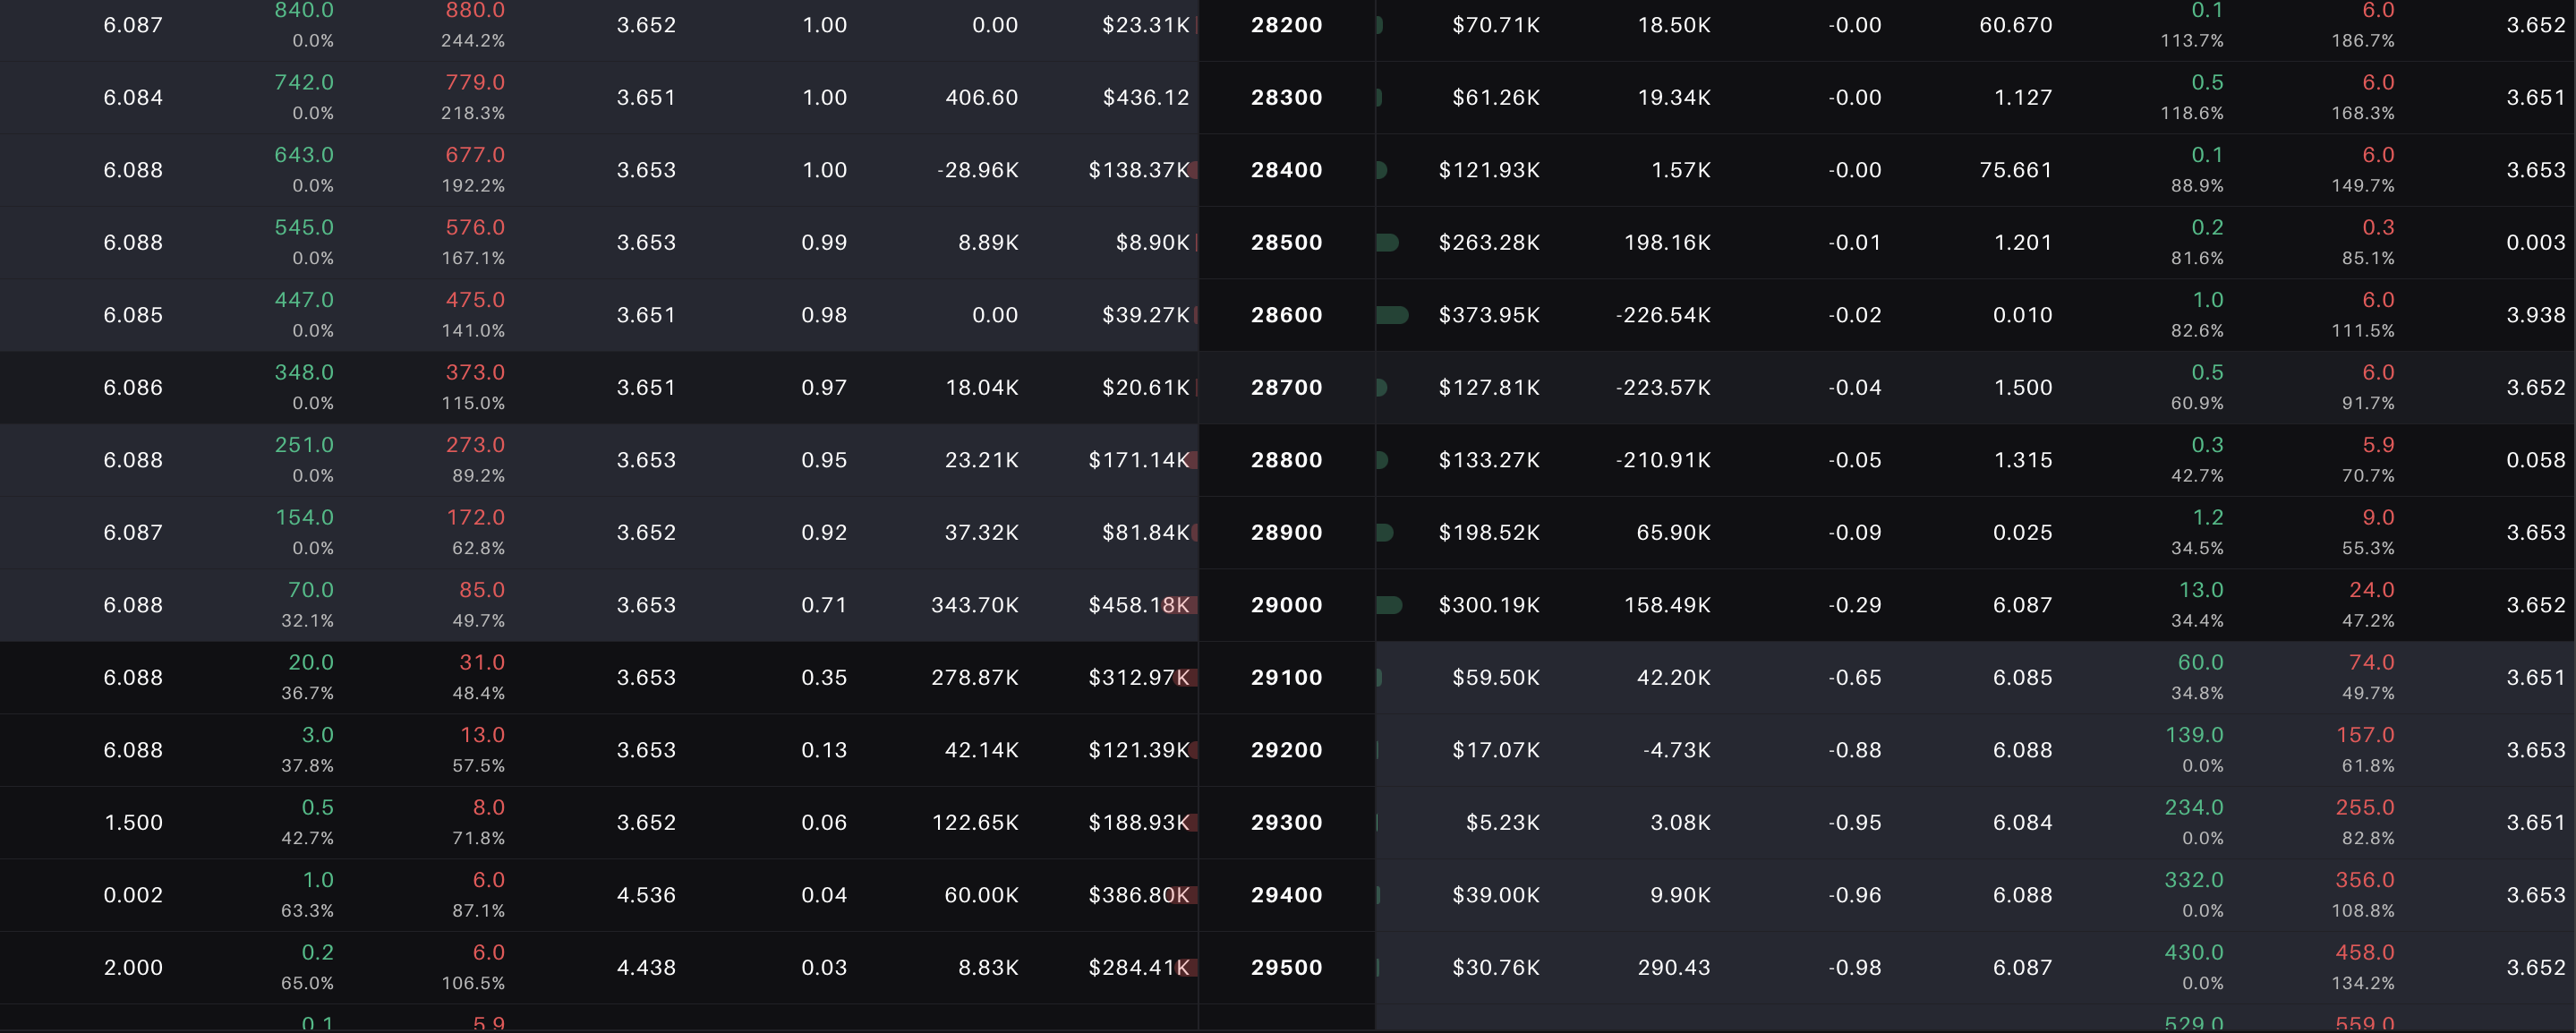
Well, reading option chain data is rather simple. While it is a table that can bombard you with a whole lot of numbers and figures from everywhere, converting it into a chart format can simplify things significantly. For example, a typical Bitcoin option chain would look something like this:
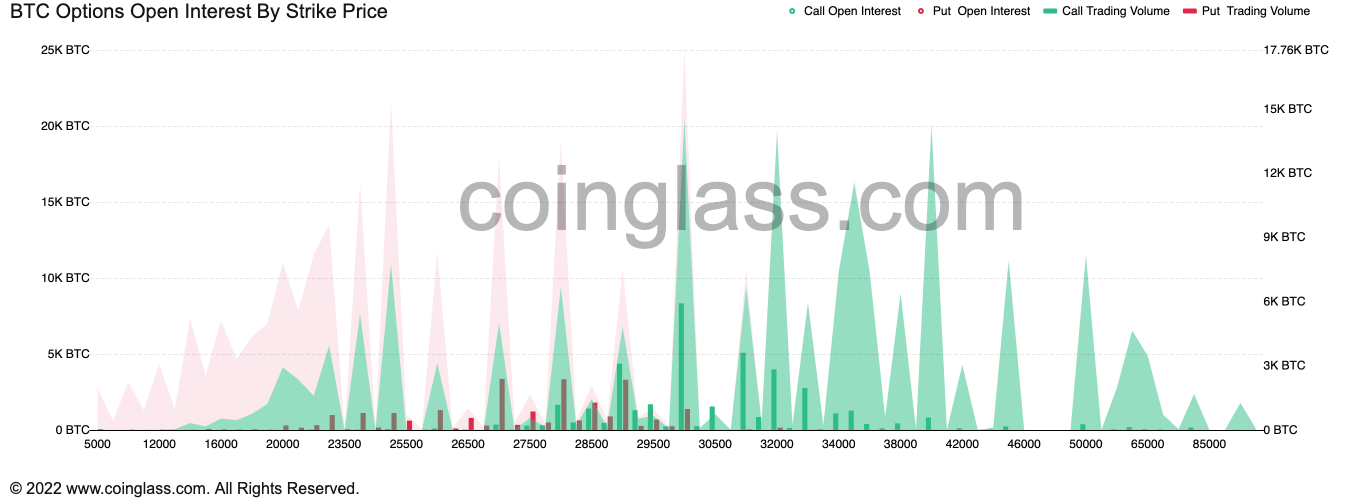
The above representation of data, for the untrained eye, can be intimidating and quite frankly, a dissuading thing. But if you were to convert the same data into a chart, then things become far simple. One of the best and free sources of option chain open interest data represented in a chart format can be accessed from Coinglass.com.
This above chart now represents the same data in a much more visual manner that is easy to interpret. As one can observe from the legend above, the red and green zones represent put and call open interest while the red and green bars represent the put and call trading volumes respectively. Additionally, the vertical axis on the left is for the open interest while the vertical axis on the right is for trading volumes.
For the purposes of this article, we will ignore call or put trading volumes for now, and only look at the open interest for both of them. As explained earlier, open interest is nothing but a representation of the number of outstanding contracts in the market, i.e. the number of call or put contracts that are active in the market at any point in time, for any specific strike price.
Option Chain Data for an Effective Crypto Trading Strategy
So now let’s get to the strategy. Before we get into the strategy, let’s understand a simple rule of thumb. While a trader buying a call option is bullish on the underlying, a trader selling that call option is moderately bearish on the underlying asset. On the other hand, a trader buying a put option is bearish on the underlying, but a trader selling that put option is moderately bullish on the underlying asset.
Thus extrapolating from that, we can define zones to support and resistances for the price of the underlying asset by looking at the out-of-the-money open interest. Thus, a very large open interest on an out-of-the-money call option serves as resistance while a very large open interest on an out-of-the-money put option serves as a support region.
Read more: Crypto Trading 101
So, how to identify support and resistance zones?
Now this part is very simple. All you need to do is find strike prices where the call open interest is higher than usual and you will have a resistance zone. Similarly, find the strike prices where the put open interest is higher than usual and you will have a support zone. Let’s take the chart from above to understand this better.
From the chart above we can clearly see, there are major spikes in call open interest (green spikes) that begin from the $30,000 mark and continues after that too. This indicates that $30,000 would be a very difficult resistance zone for Bitcoin price to break out of.
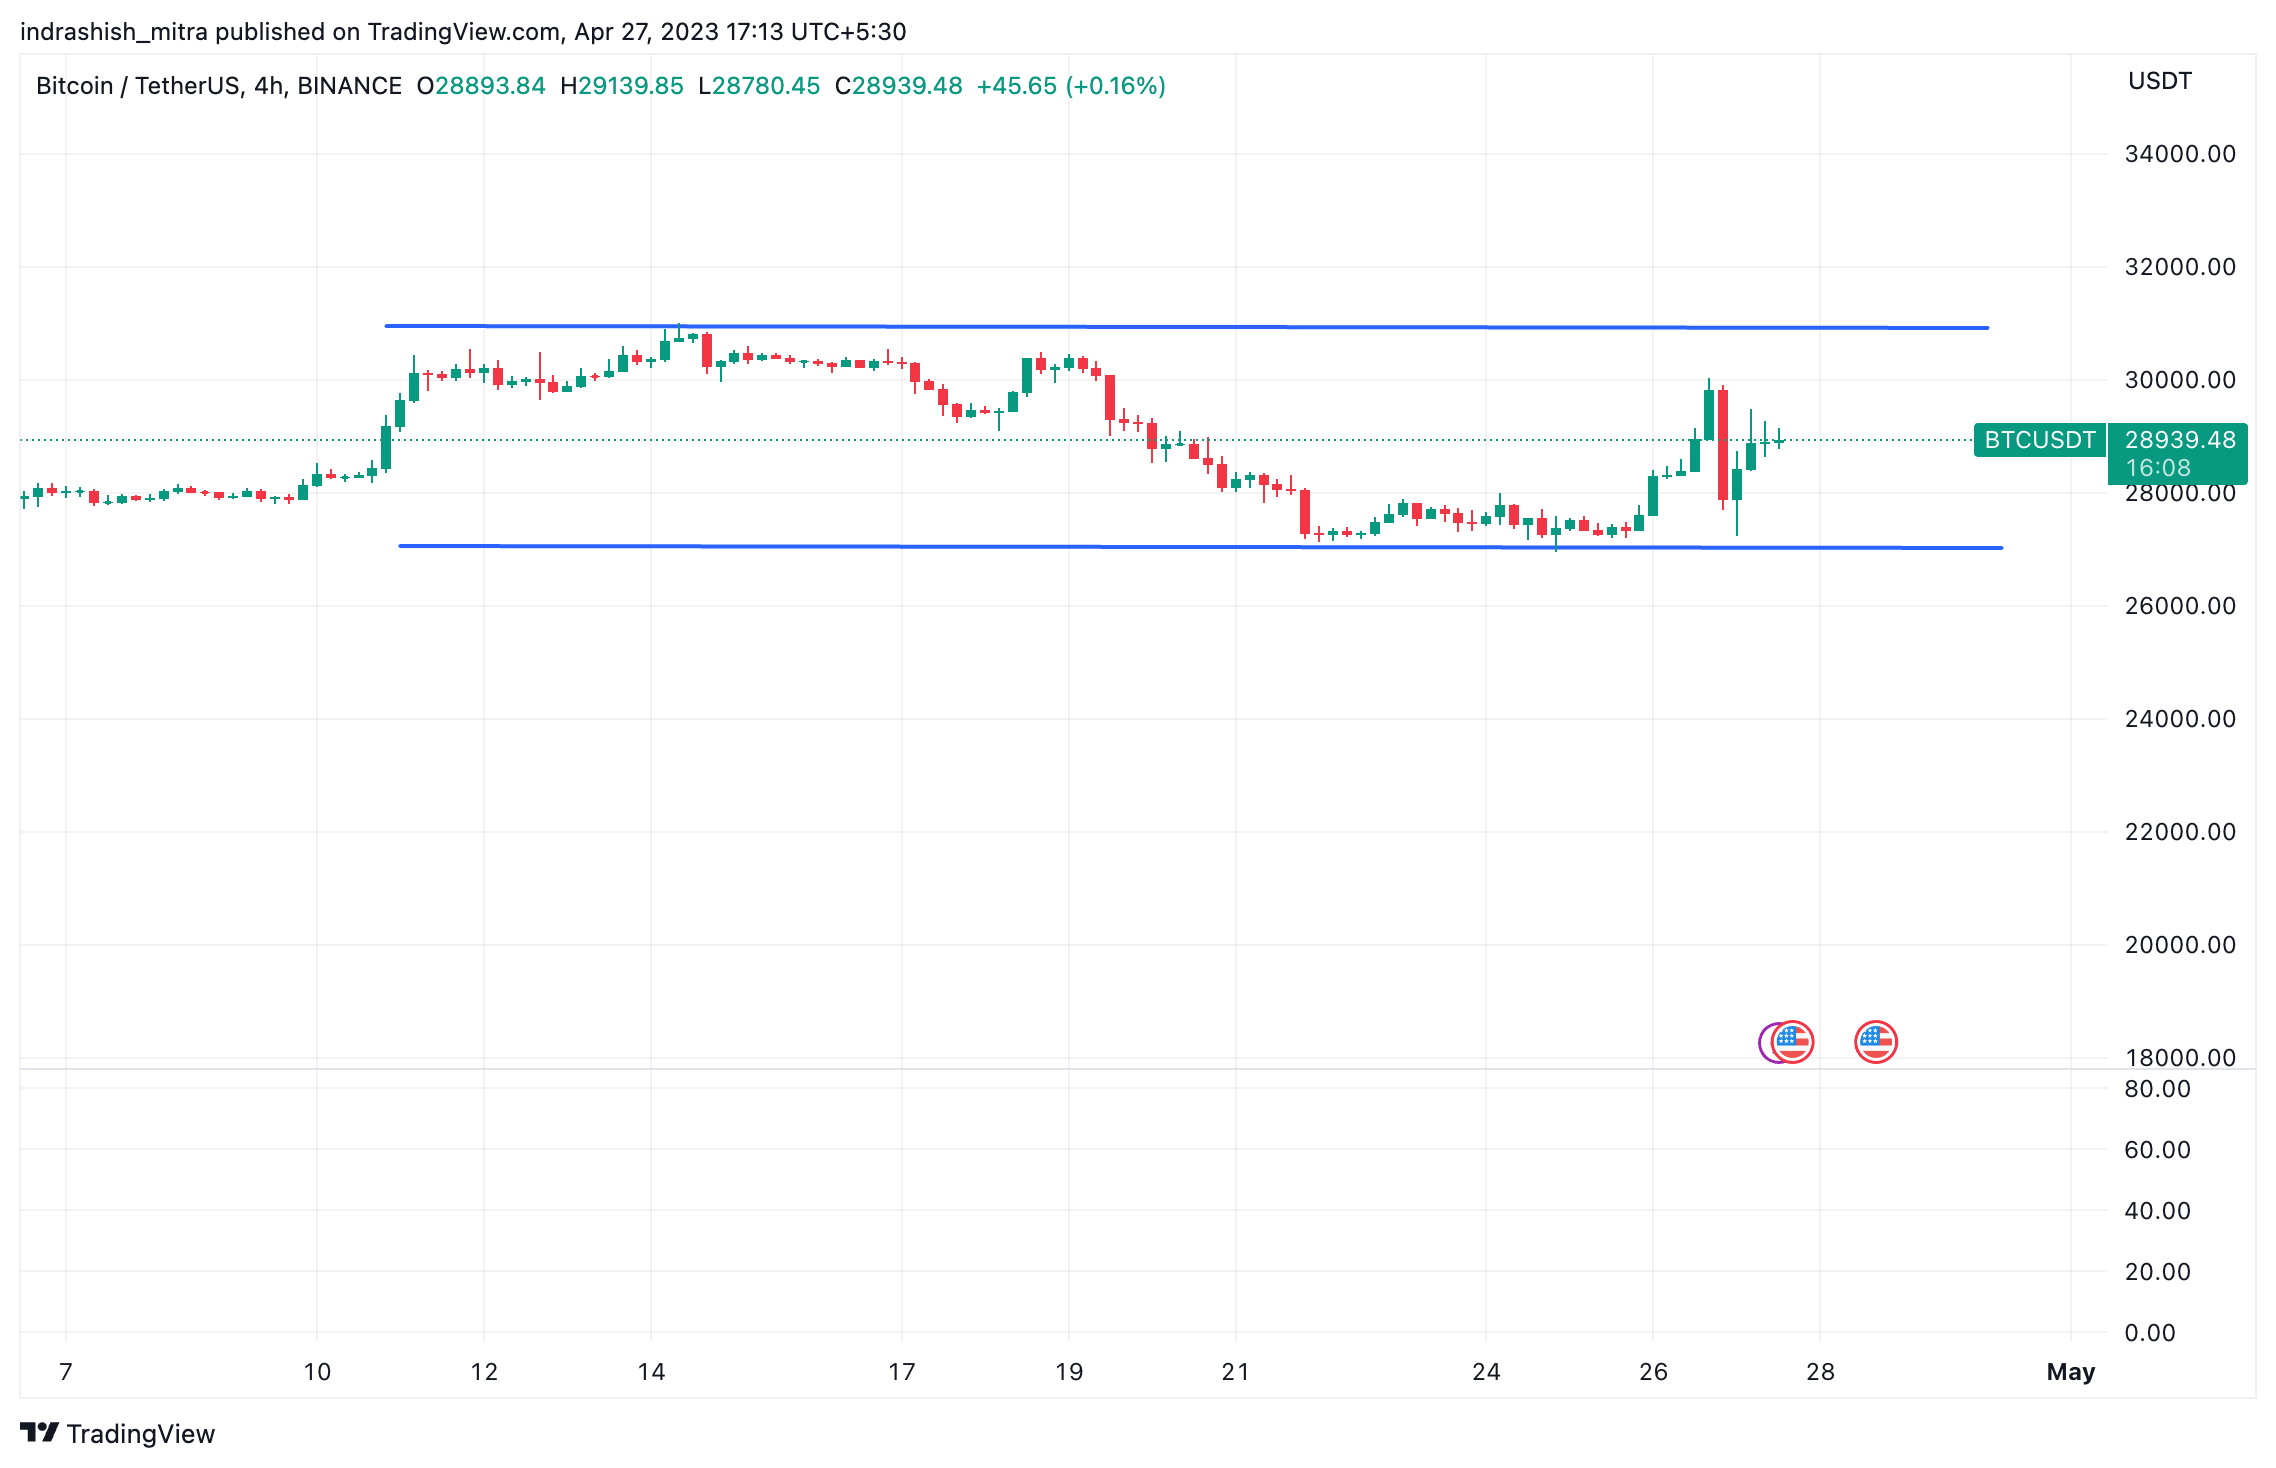
On the other hand, if you see closely, there are major spikes in the put open interest (red spikes). that begin from $28,000 and there is a spike at the $27,000 strike price too. Now the above analysis has held true if you were to look at Bitcoin trading prices in the last two weeks.
As indicated by the blue horizontal trendlines on the chart, one can observe how BTC/USDT trading pair was only able to go up to about $30,800 below quickly falling back down below $30,000 due to the strong resistance created by the over-supply related selling pressures at that price level.
Hence, going forward too, we can expect these levels to be maintained. However, as all things go, this isn’t something that is etched in stone, but rather a process of weighing the odds. At the moment, this seems to be the scenario, things might change very quickly, as is the nature of the crypto market.
Option Chain Data in Crypto Futures
This data can be used for spot crypto trading & crypto futures trading. As is the case with crypto futures, which are perpetual in nature – these contracts generally tend to track the spot crypto prices very closely and thus, a more experienced trader who wants to take advantage of the leverage functionality to improve profitability can use this technique to further supplement their overall trading strategy and improve the odds in their trading journey!
Read more: Crypto Futures Trading Explained
FAQ
How do you evaluate an option chain?
An option chain is a data set that is derived from the options market trading activity and is a very effective measure of the market sentiment and thus can be used to determine support and resistance levels for the price of the underlying asset.
How to use Option Chain Data for Futures Trading?
As is the case with crypto futures, which are perpetual in nature - these contracts generally tend to track the spot crypto prices very closely and thus, a more experienced trader who wants to take advantage of the leverage functionality to improve profitability can use option chain data to further supplement their overall trading strategy and improve the odds in their trading journey!
Related posts
Understanding the Different Types of Cryptos: Coins, Tokens, Altcoins & More Explained
Explore the major types of crypto assets and their unique roles.
Read more
PAWS Telegram Game: The New Tap to Earn Game That Is Beating Hamster Kombat
Discover how to play and earn with PAWS Telegram game.
Read more
